
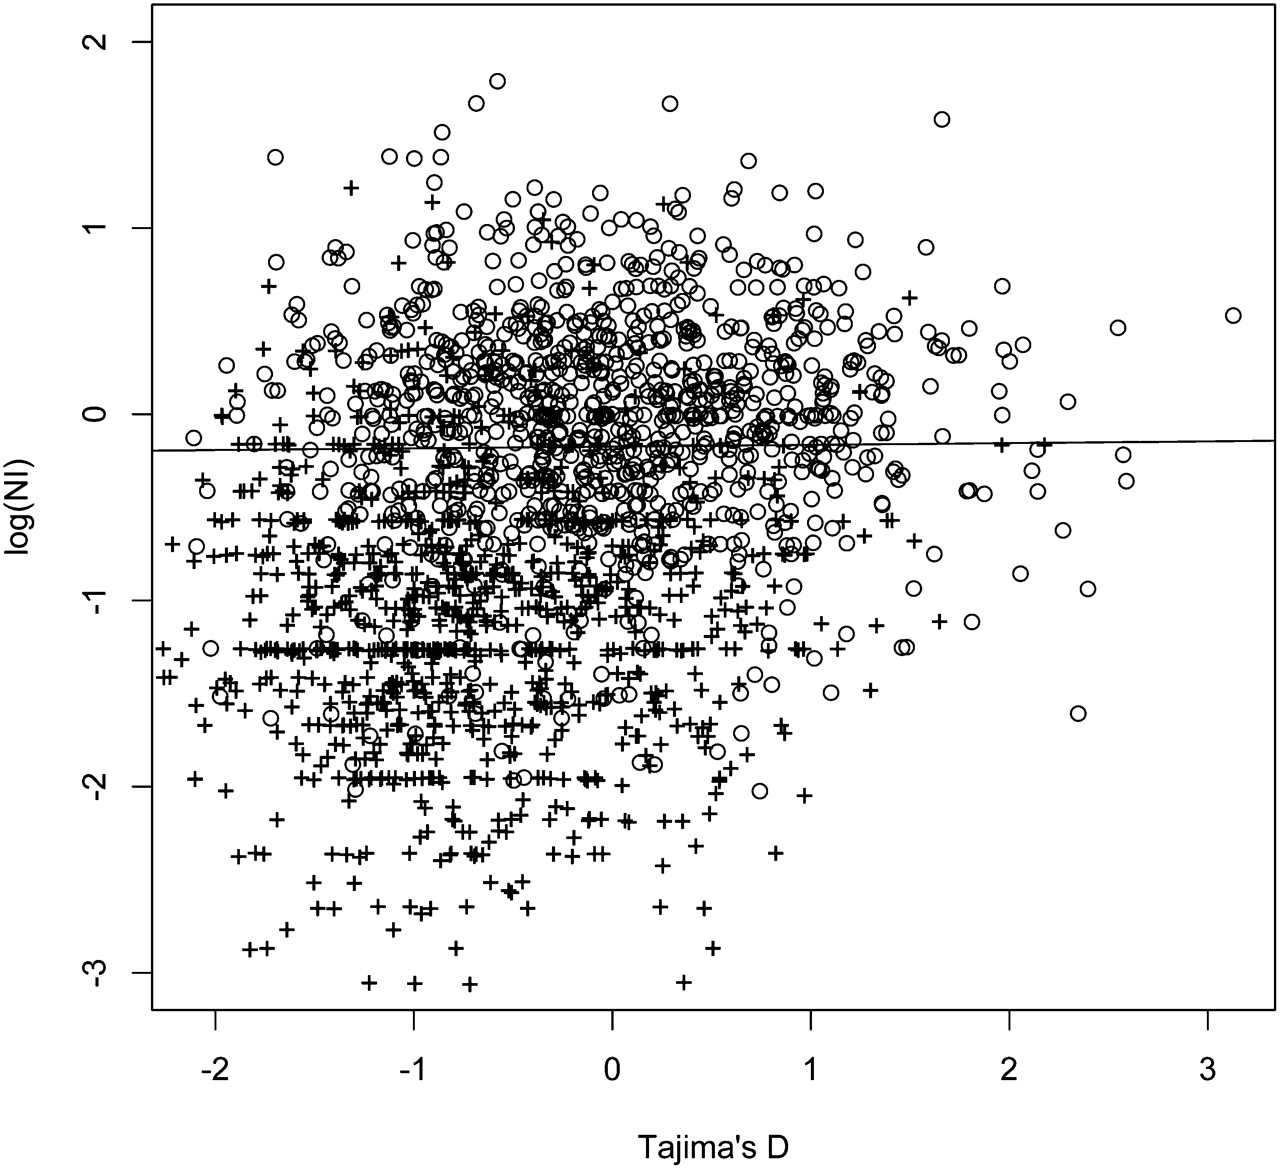
Figure 5.
The distribution of values of the logarithm of the neutrality index (NI) and Tajima's D in 1000 simulations under a neutral model (○) and a model involving repeated selective sweeps (+). The parameter values and details of the simulations are described in the main text. The regression line is obtained for neutral data points only and has a slope very close to zero (−0.0093). Notice that almost all points with small values of log(NI) and small values of Tajima's D are data points simulated under the selection model.


