
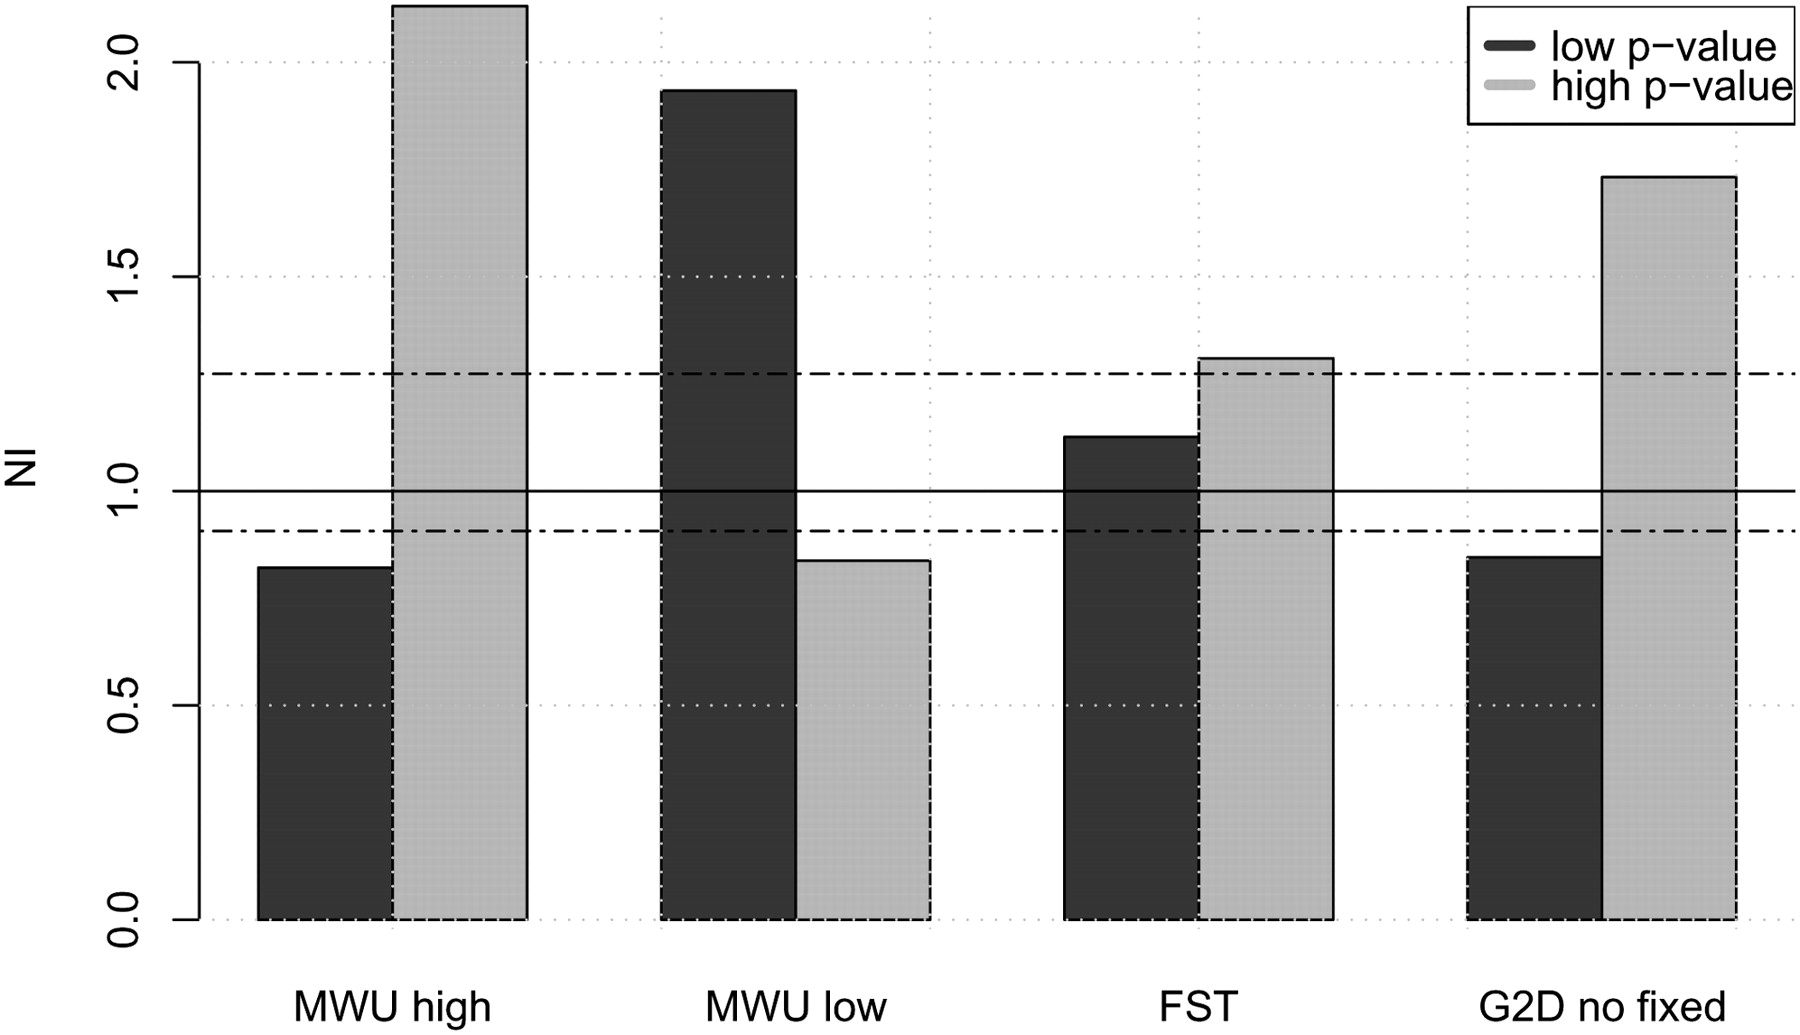
Figure 3.
The median neutrality index (NI) in the 200 genes with largest (light) and smallest (dark) P-value in the MWU-high, MWU-low, and FST and G2D tests without fixed differences. The dotted line indicates the global median of NI. Values above one (solid line) indicate negative selection, values below positive selection.


