
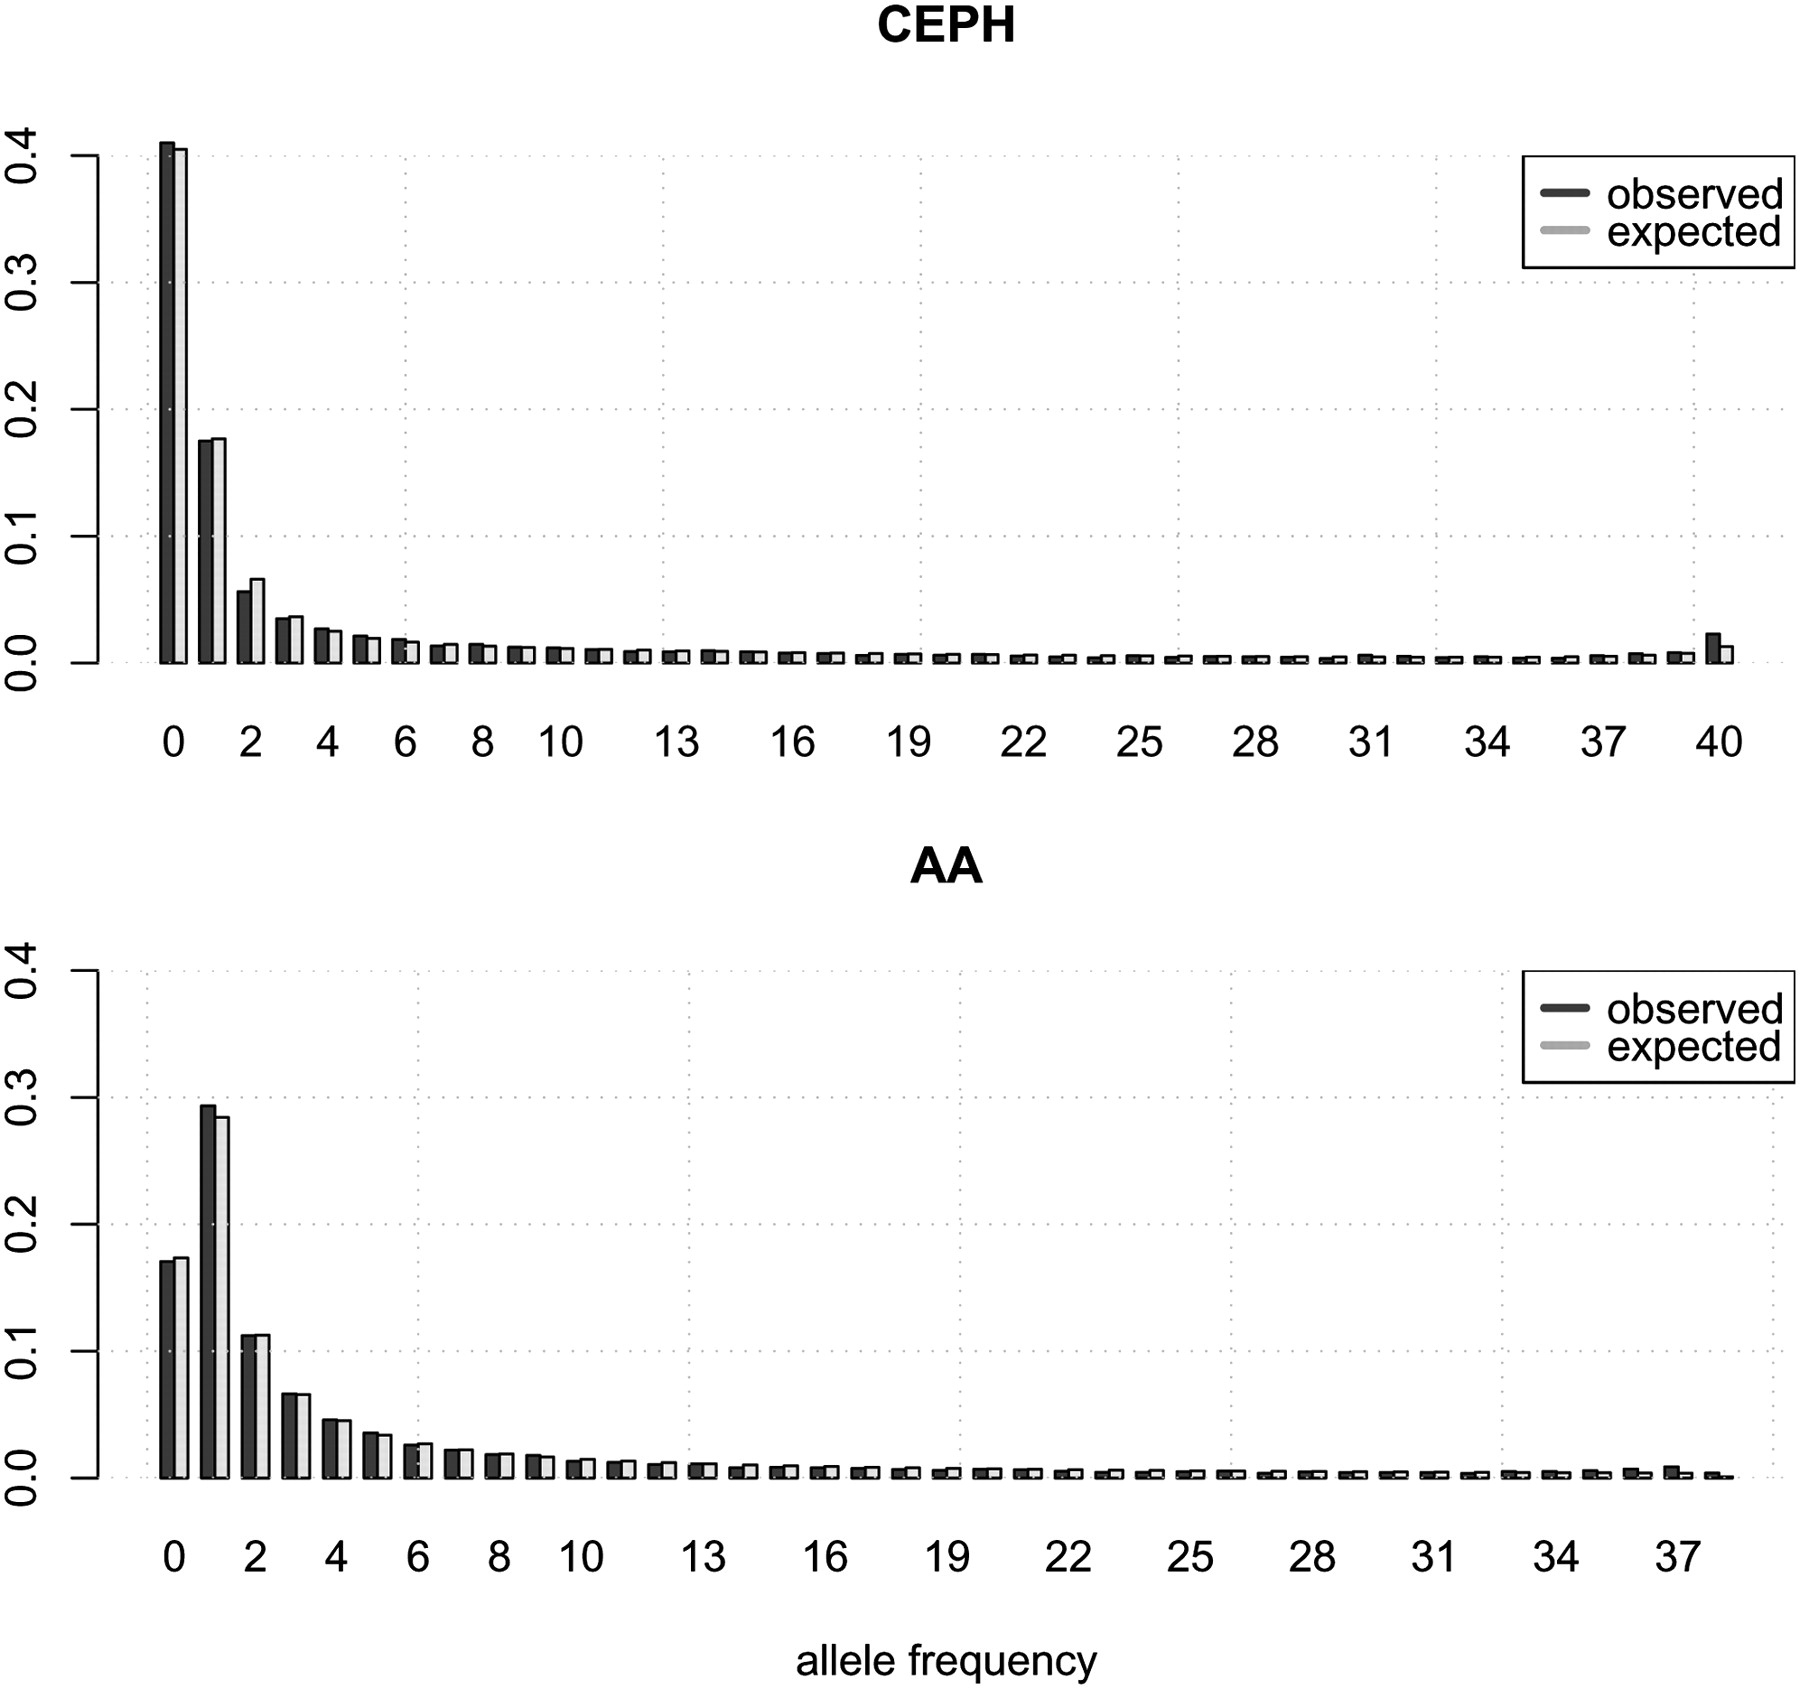
Figure 2.
The unfolded marginal frequency spectra predicted from the best-fitting model (simulated) and the observed marginal frequency for European-Americans (top) and African-Americans (bottom) from the autosomal data. The zero category represents SNPs that are absent from one population but present in the other.


