
Figure 1.
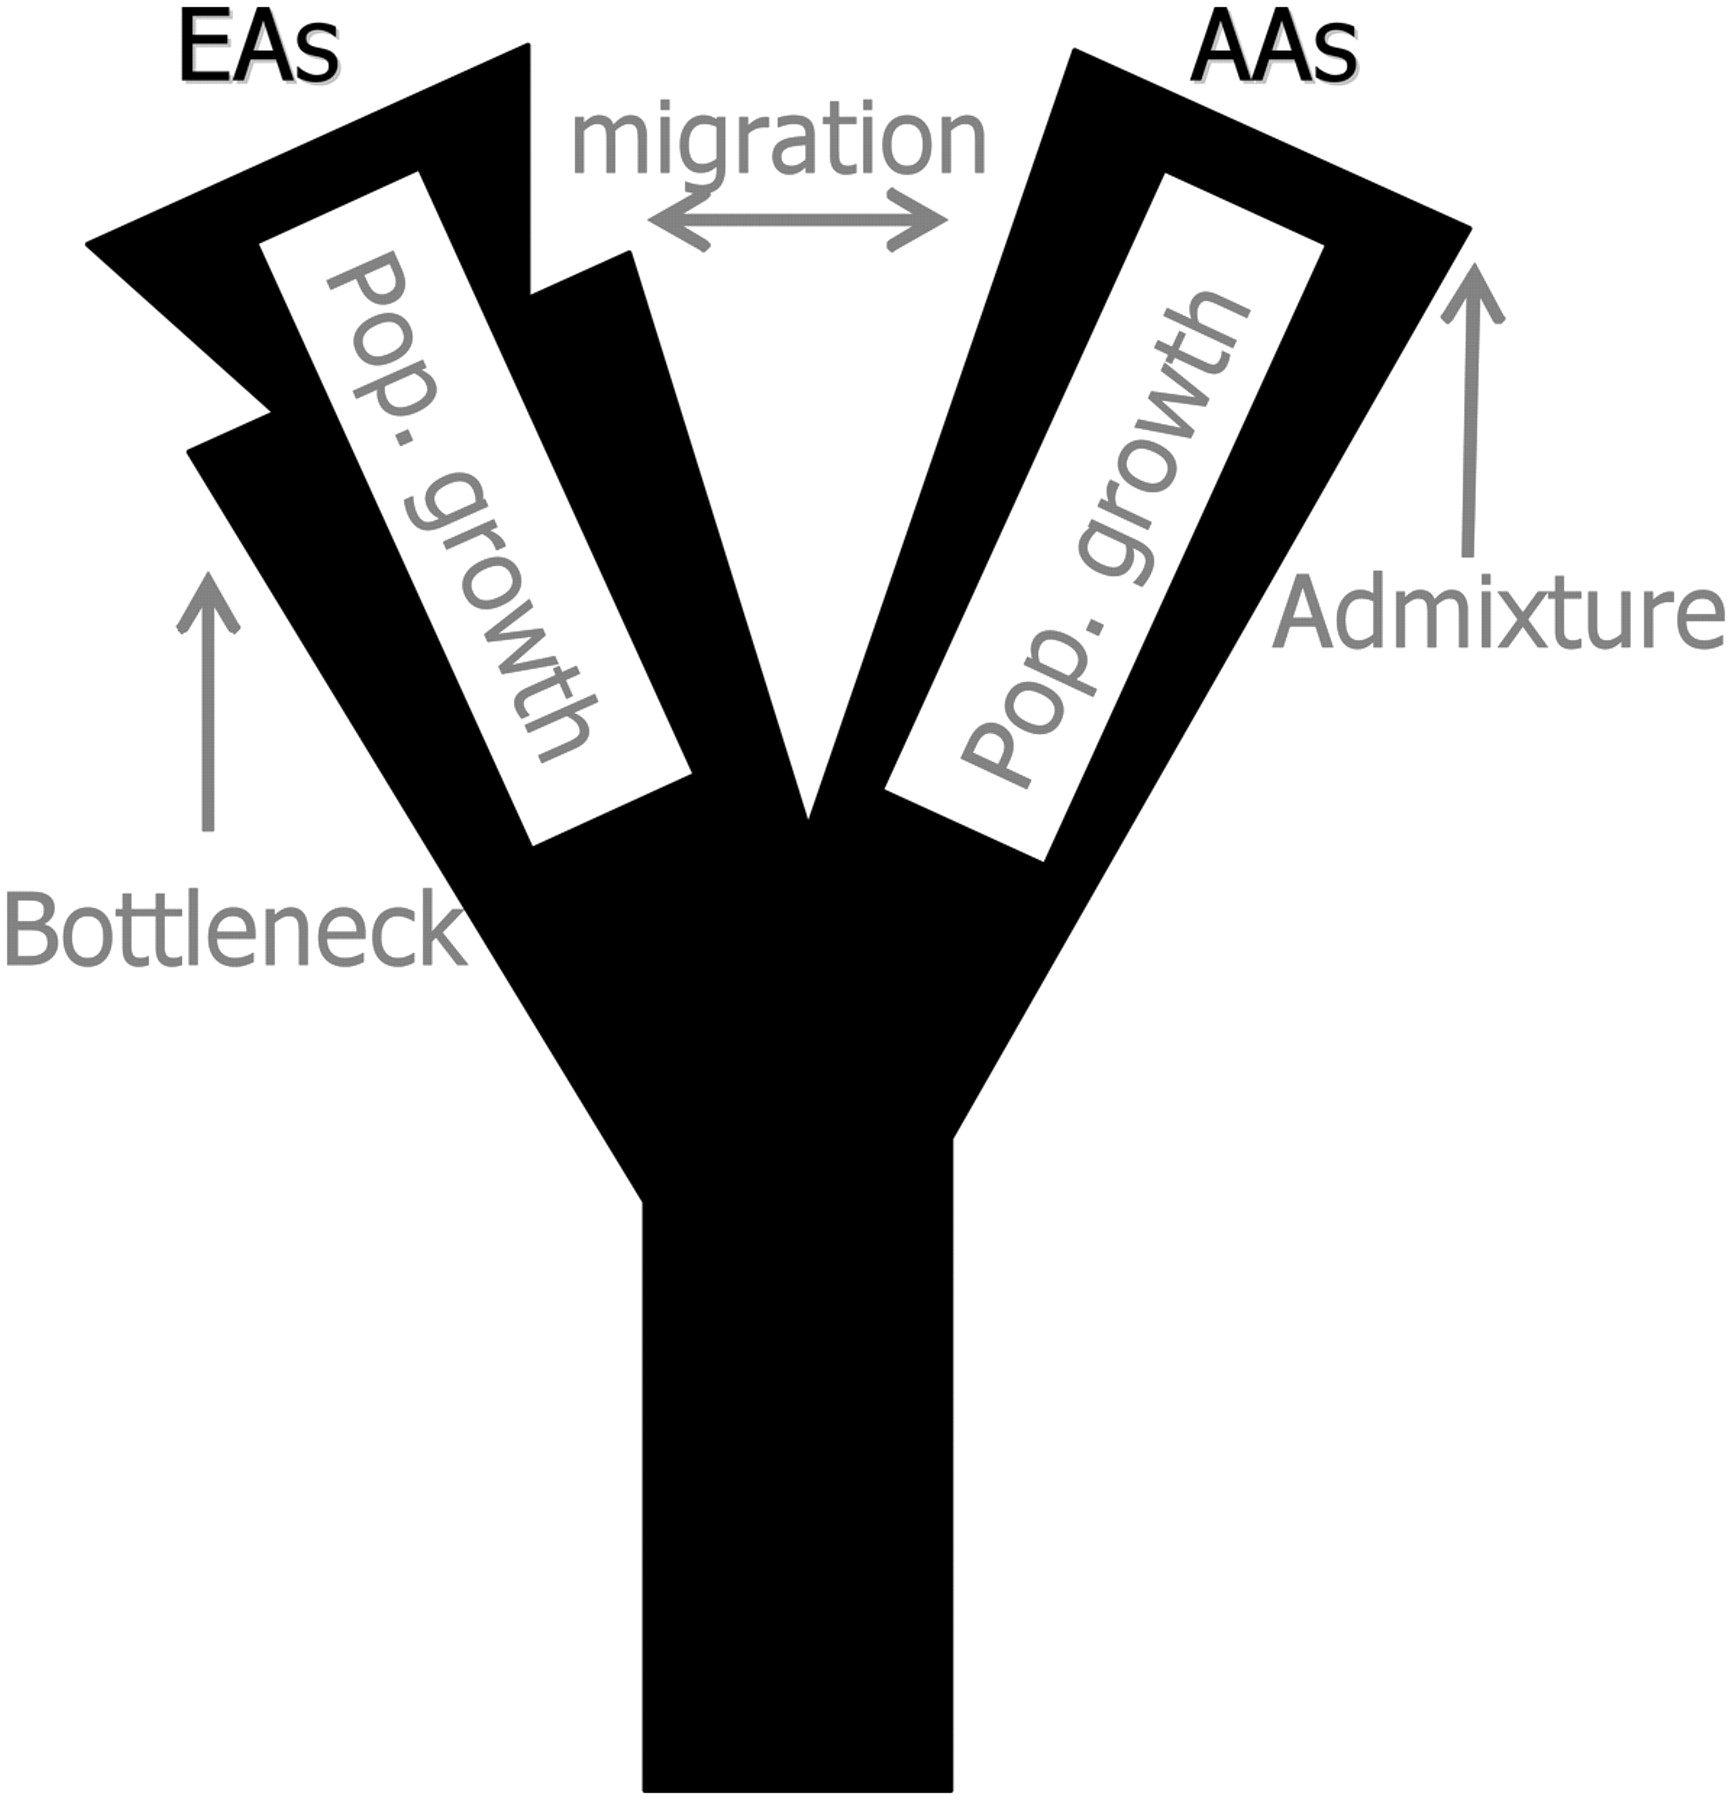
A graphical illustration of the model of the demographic history of European-Americans (EAs) and African-Americans (AAs).
(Downloading may take up to 30 seconds. If the slide opens in your browser, select File -> Save As to save it.)
Click on image to view larger version.
A graphical illustration of the model of the demographic history of European-Americans (EAs) and African-Americans (AAs).
 CiteULike
 Delicious
 Digg
Digg Facebook
 Google+
 Reddit
 Twitter
