
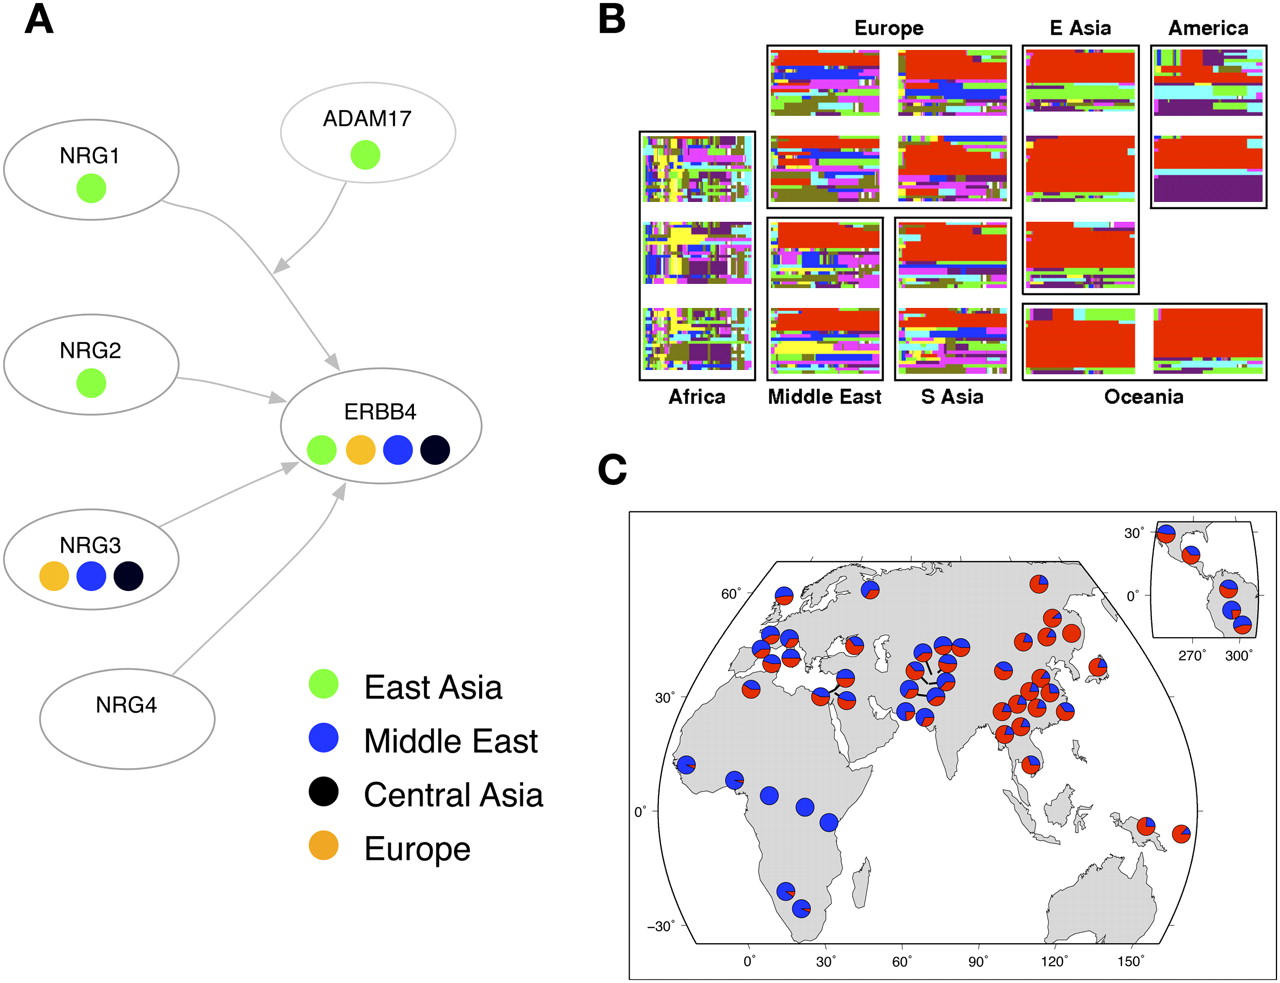
Selection signals in the NRG–ERBB4 pathway. (A) A schematic of the NRG–ERBB4 pathway, drawn from interactions reported in KEGG (Kanehisa et al. 2008) and Mei and Xiong (2008). Each oval represents a gene, and the colored circles denote the geographic regions that have significant selection signals (empirical scores in the top 5% of the distribution). We excluded Oceania and the Americas from this plot since selection scans are expected to have low power in these regions. For ADAM17, the selection statistic is XP-EHH; for the others it is iHS. (B) Haplotype plots at the putative selected region in ERBB4. (C) Worldwide allele frequencies of a SNP that tags the red haplotype in B (rs1505353). (Red) The derived allele; (blue) the ancestral allele.


