
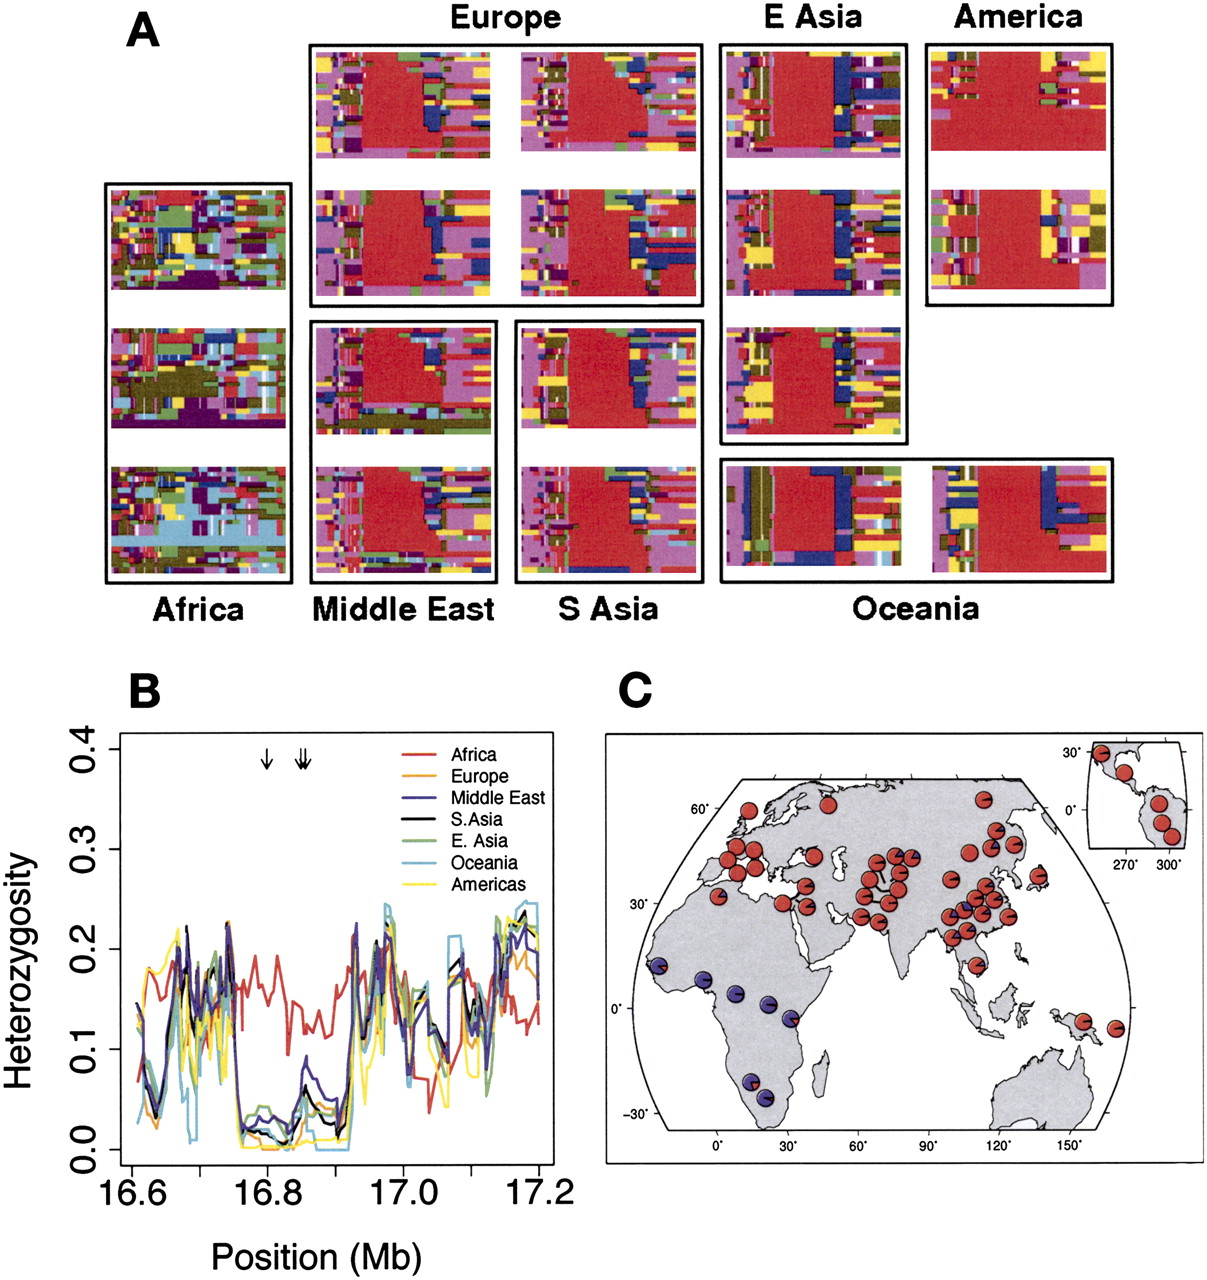
Evidence for selection in a region containing part of the gene C21orf34. (A) Haplotype plots in a 500-kb region on chromosome 21 surrounding the locus. Each row represents a haplotype, and each column a SNP. Rows are colored the same if and only if the underlying sequence is identical (some low-frequency SNPs are excluded). For full details on the generation of these plots, see Conrad et al. (2006). (B) Heterozygosity in the same region. Lines show heterozygosity calculated in a sliding window of three SNPs across the region in different populations. Black arrows at the top of the plot represent the positions of SNPs with FST > 0.6 (i.e., in the 0.01% tail of worldwide FST). (C). A pie chart of the worldwide distribution of a SNP that tags the red haplotype in A (rs2823850). (Red) The derived allele frequency; (blue) the ancestral allele frequency.


