
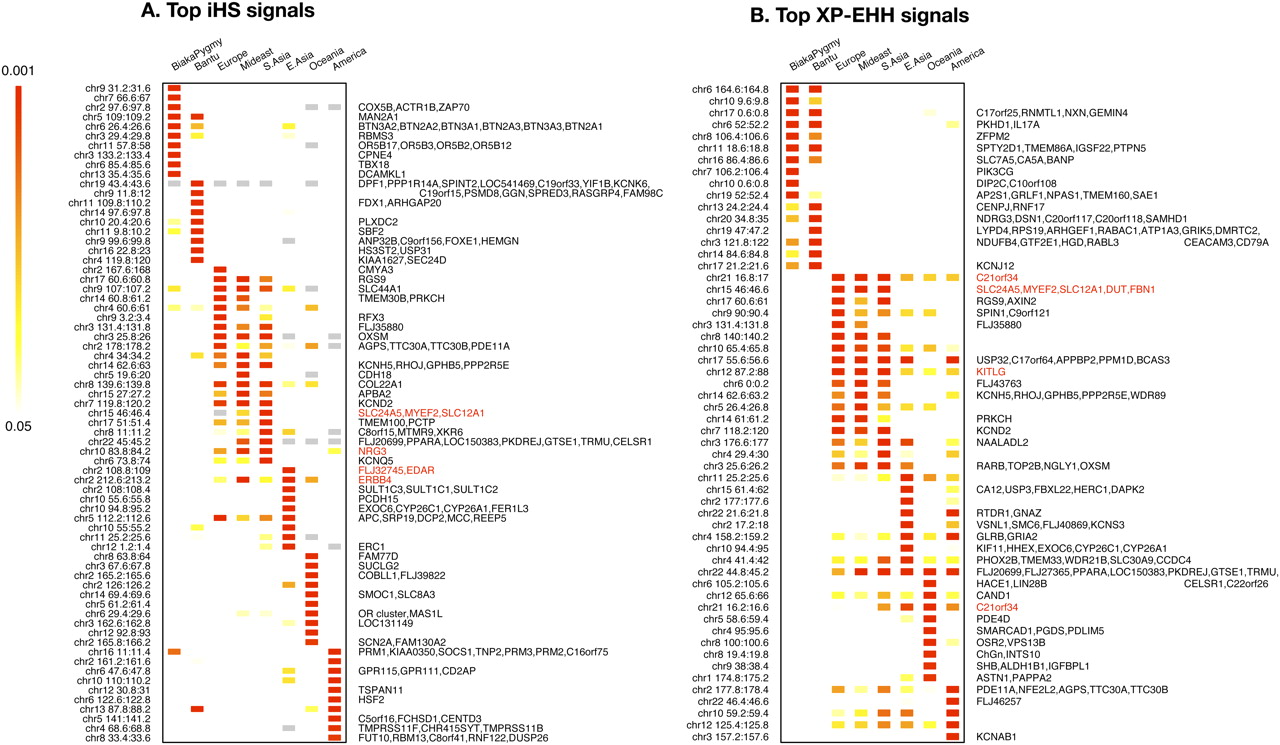
Top 10 iHS (A) and XP-EHH (B) signals by population cluster. Each row is a 200-kb genomic window, each column is a geographic region, and each cell is colored according to the position of the window in the empirical distribution of scores for that region. Plotted are the most extreme 10 windows for each geographic region. Gray cells in A are windows that have fewer than 20 SNPs for which iHS was calculated (see Methods). To the right of each row is a list of genes that fall in the window. Windows where the genes are in red are discussed in the text. Note that interpretation of the overlap in XP-EHH signals is complicated by the need for a reference population; see the main text.


