
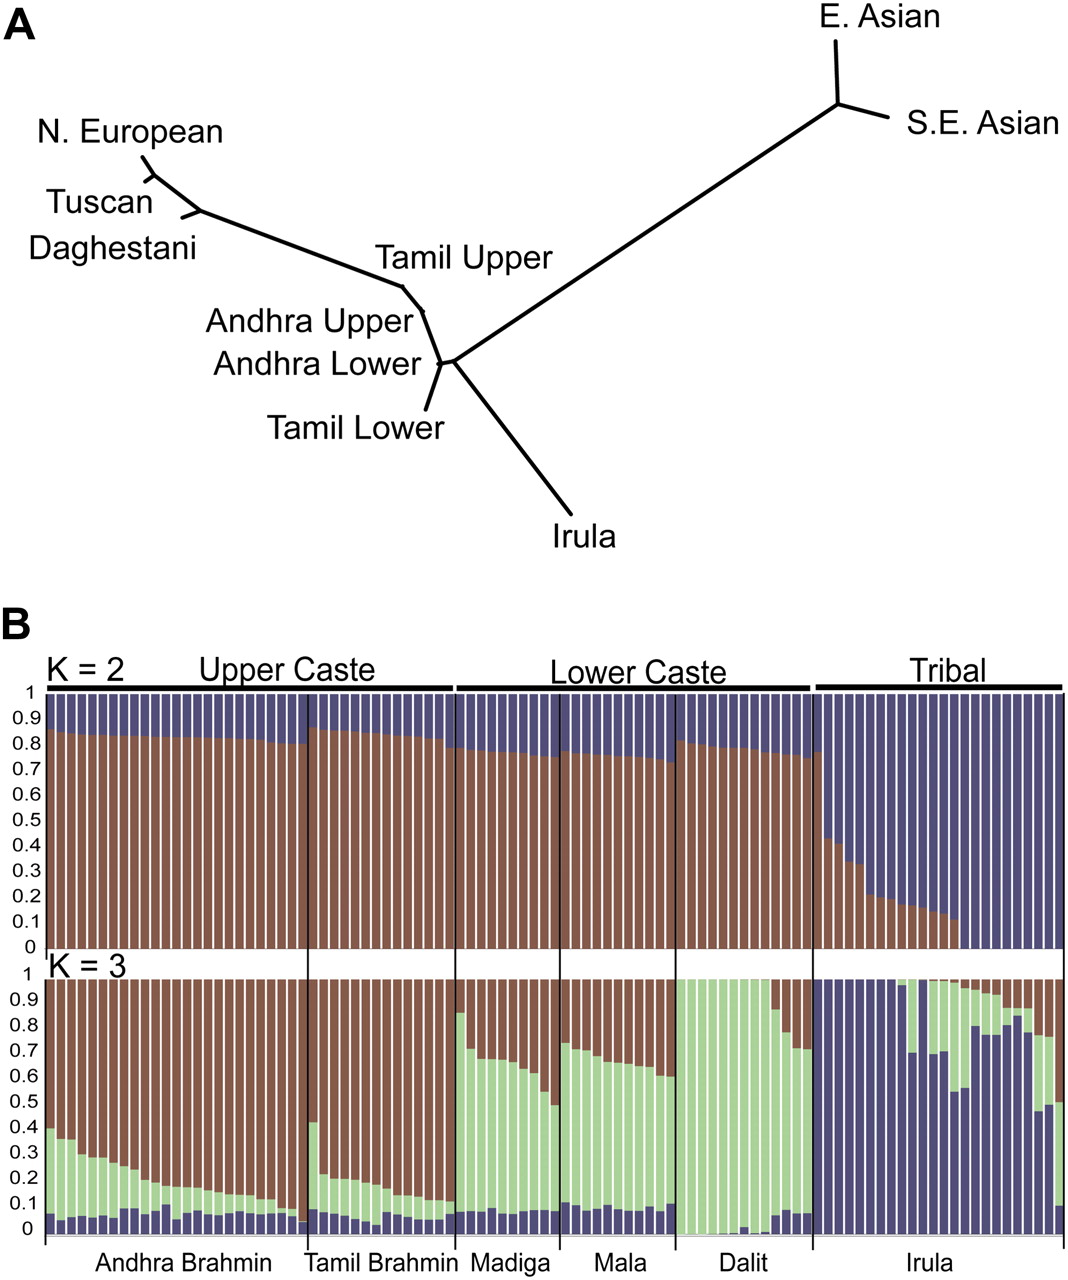
Figure 5.
Genetic variation in South India. (A) Neighbor-joining network of Eurasian and Indian populations based on pairwise FST distances. (B) Individual grouping inferred by FRAPPE in South Indian populations with K = 2 and K = 3. Each individual's genome is represented by a vertical bar composed of colored sections, where each section represents the proportion of an individual's ancestry derived from one of the K ancestral populations. Individuals are arrayed horizontally and grouped by population (labeled on the bottom of the graph) and caste (labeled on the top of the graph).


