
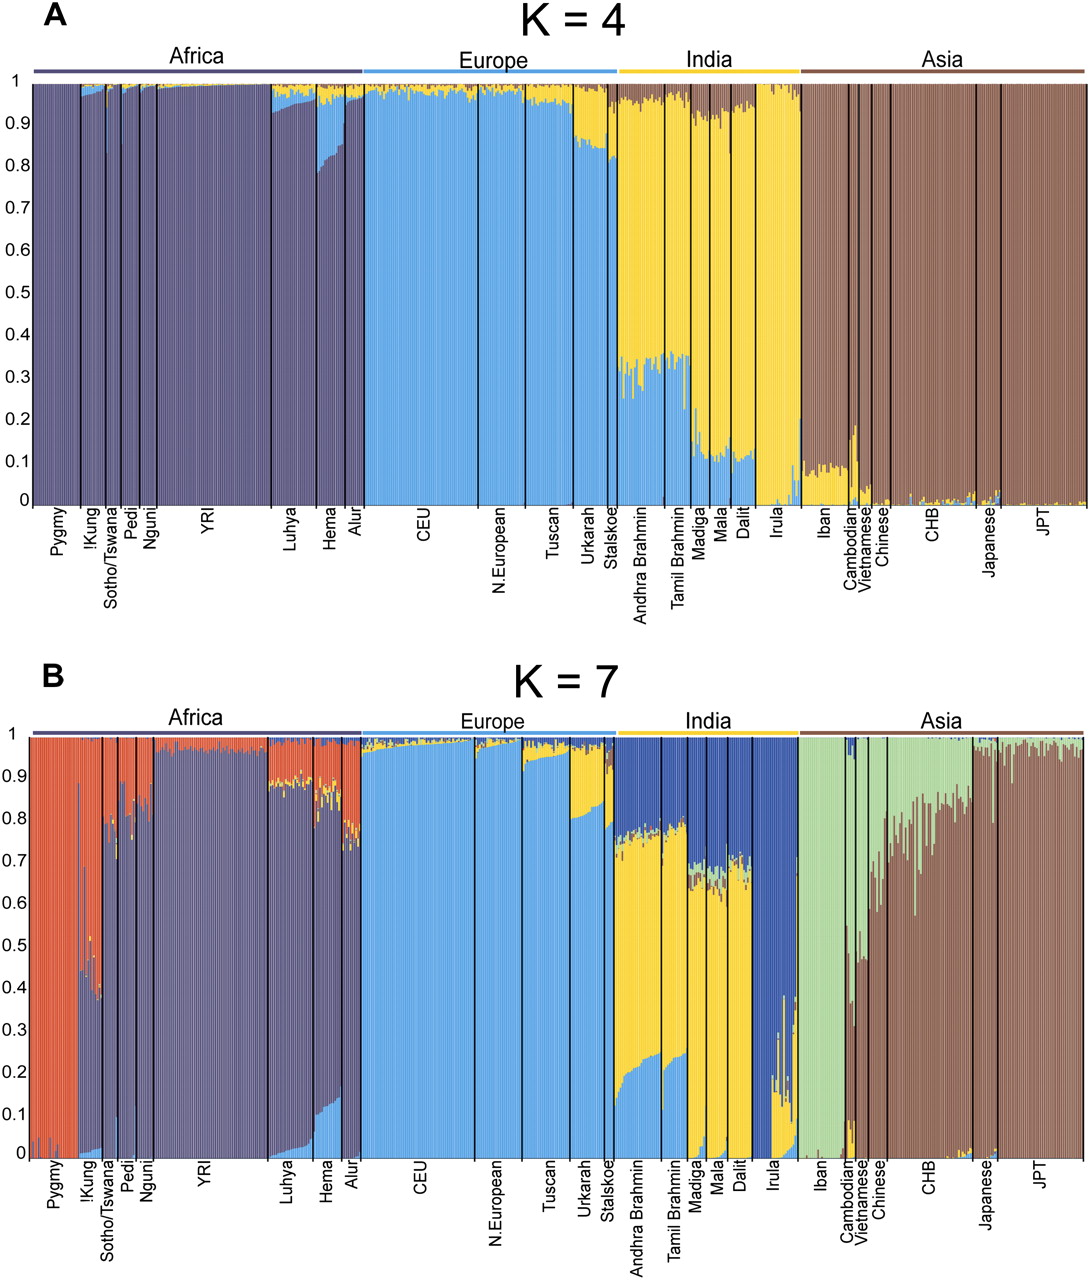
Figure 4.
Individual grouping inferred by FRAPPE. (A) K = 4; (B) K = 7. Each individual's genome is represented by a vertical bar composed of colored sections, where each section represents the proportion of an individual's ancestry derived from one of K ancestral populations. Individuals are arrayed horizontally and grouped by population (labeled on the bottom of the graph) and continent of origin (labeled on the top of the graph).


