
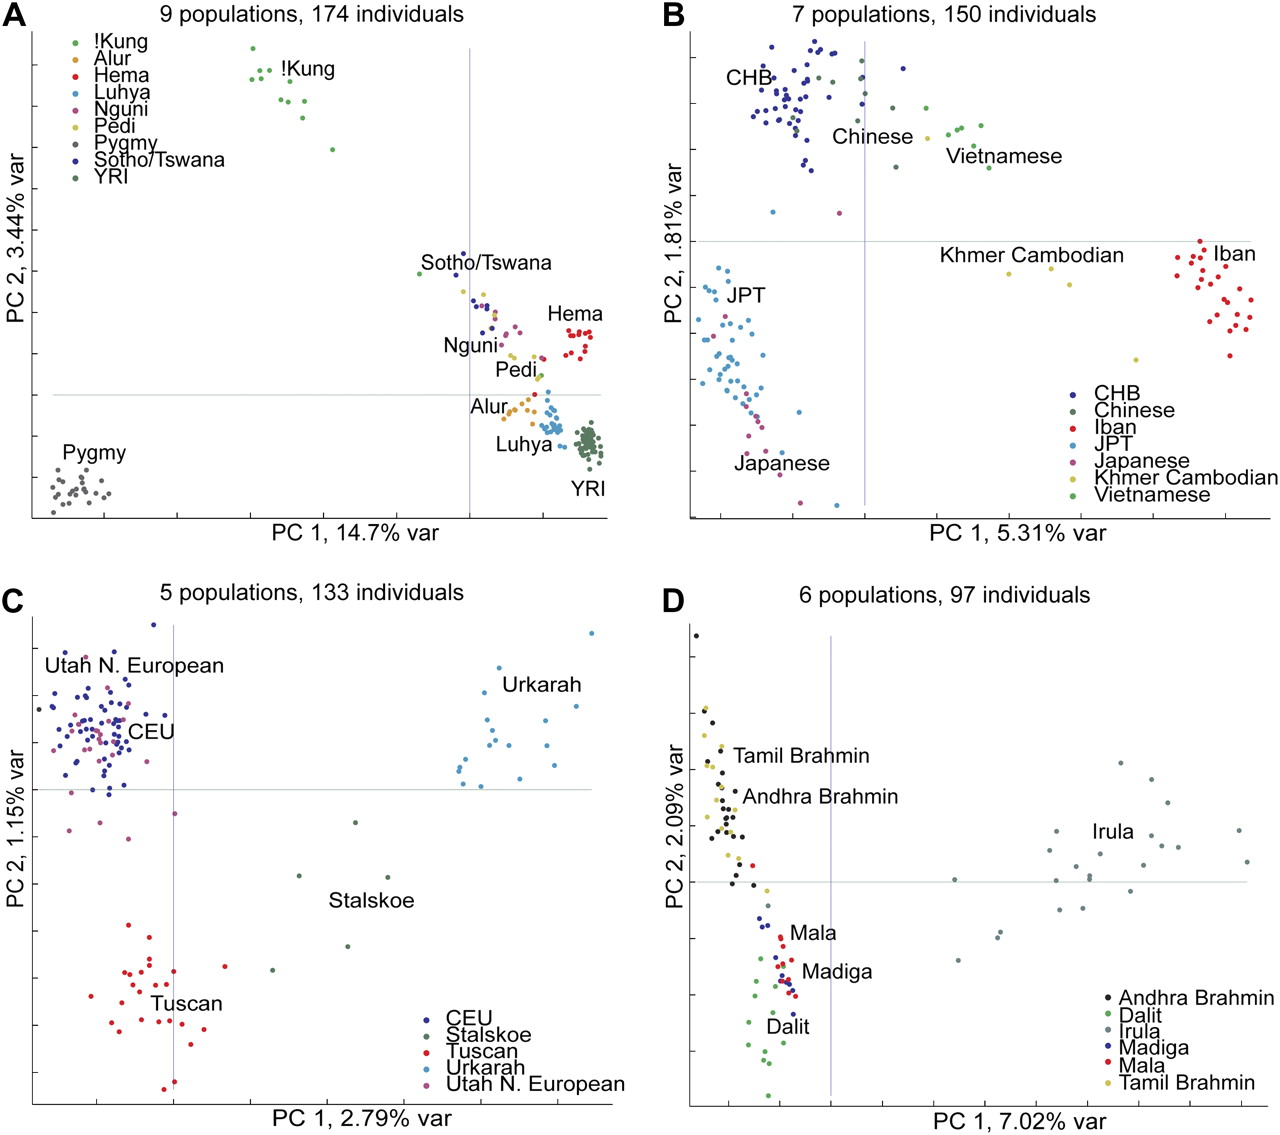
Figure 3.
Principal components analysis of population structure in each continental group. (A) Africa, (B) East/Southeast Asia, (C) Europe, and (D) India. First two PCs are shown. Each individual is represented by one dot and the color label corresponding to their self-reported population origin. The percentage of variation explained by each PC is shown on the axes.


