
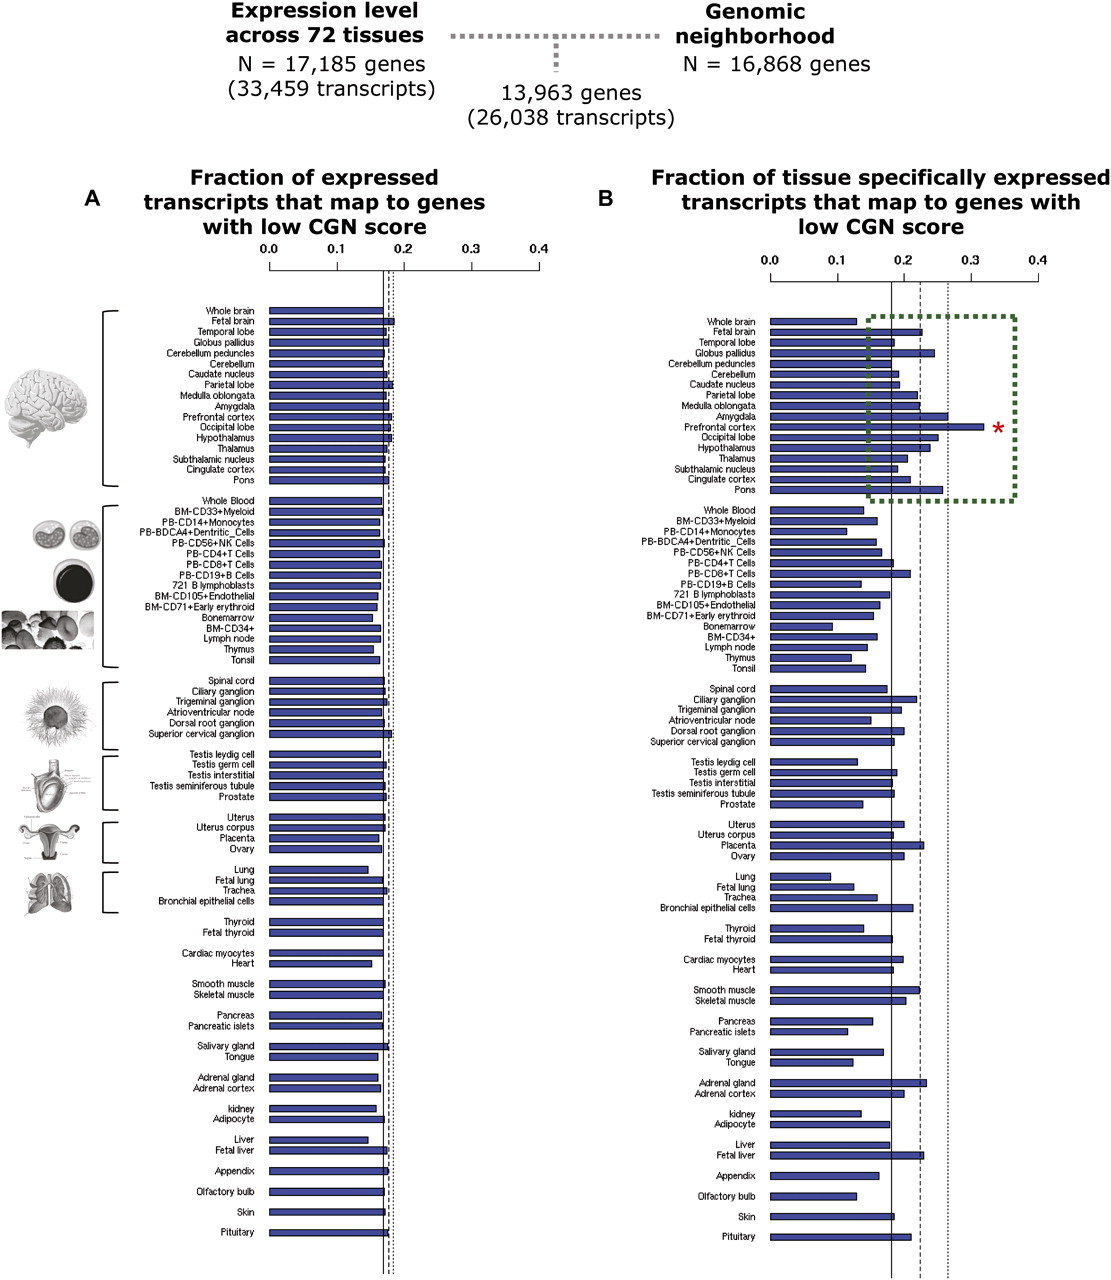
Distribution of the fraction of transcripts that map to genes with low CGN which are expressed (A) and expressed in a tissue-specific manner (expression breadth < 0.1) (B) for the various tissues. 13,963 genes for which expression data and CGN score are available were investigated. (A) The ratio of transcripts that map to genes with low CGN to all the transcripts expressed in that tissue is shown for each of the 72 tissue types. (B) The ratio of tissue-specific transcripts from genes with low CGN to all transcripts that are expressed in a tissue-specific manner in that tissue is shown. The mean value across all tissues is shown by a continuous line and the first standard deviation represented by a broken line. Prefrontal cortex, which has the highest overrepresentation of tissue-specific expressed transcripts that map to genes with altered neighborhoods, is marked with a red asterisk. All brain tissues with above-mean proportion of tissue-specific transcripts from genes with altered neighborhoods are highlighted by a dashed green box.


