
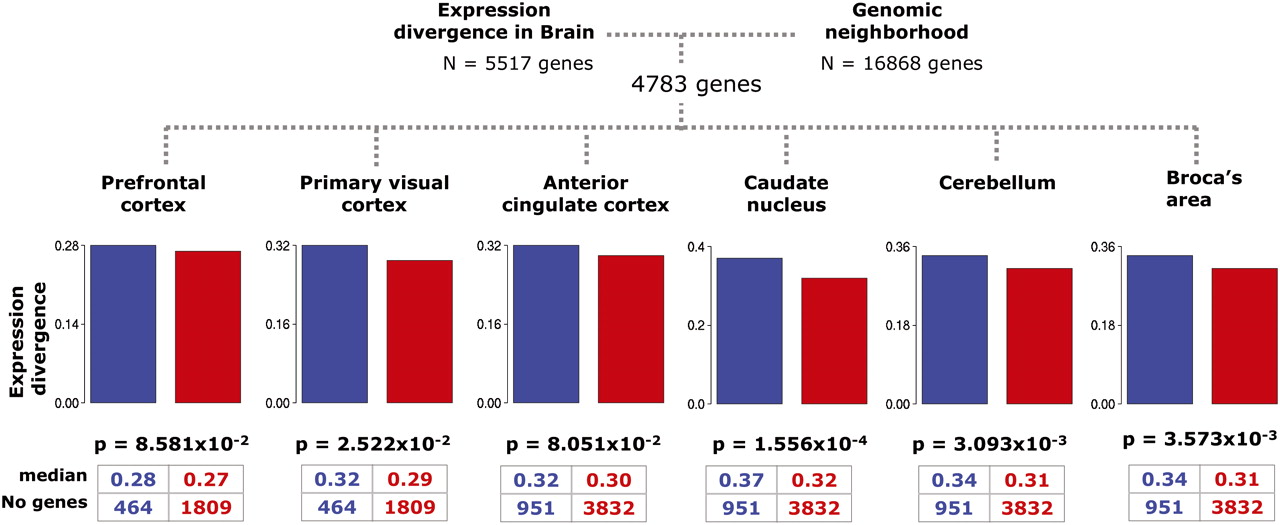
Figure 4.
Investigating the impact of alteration in gene neighborhood on gene expression divergence in different brain parts. Distributions of the expression divergence value for genes with conserved (red) and altered (blue) neighborhood are compared using the Mann-Whitney test for six different brain parts. Y-axis is in log-scale. For visual clarity, median expression and sample size (i.e., number of genes) for genes with conserved and altered neighborhood categories are shown for each brain part. See Supplemental Table S8 for control calculations.


