
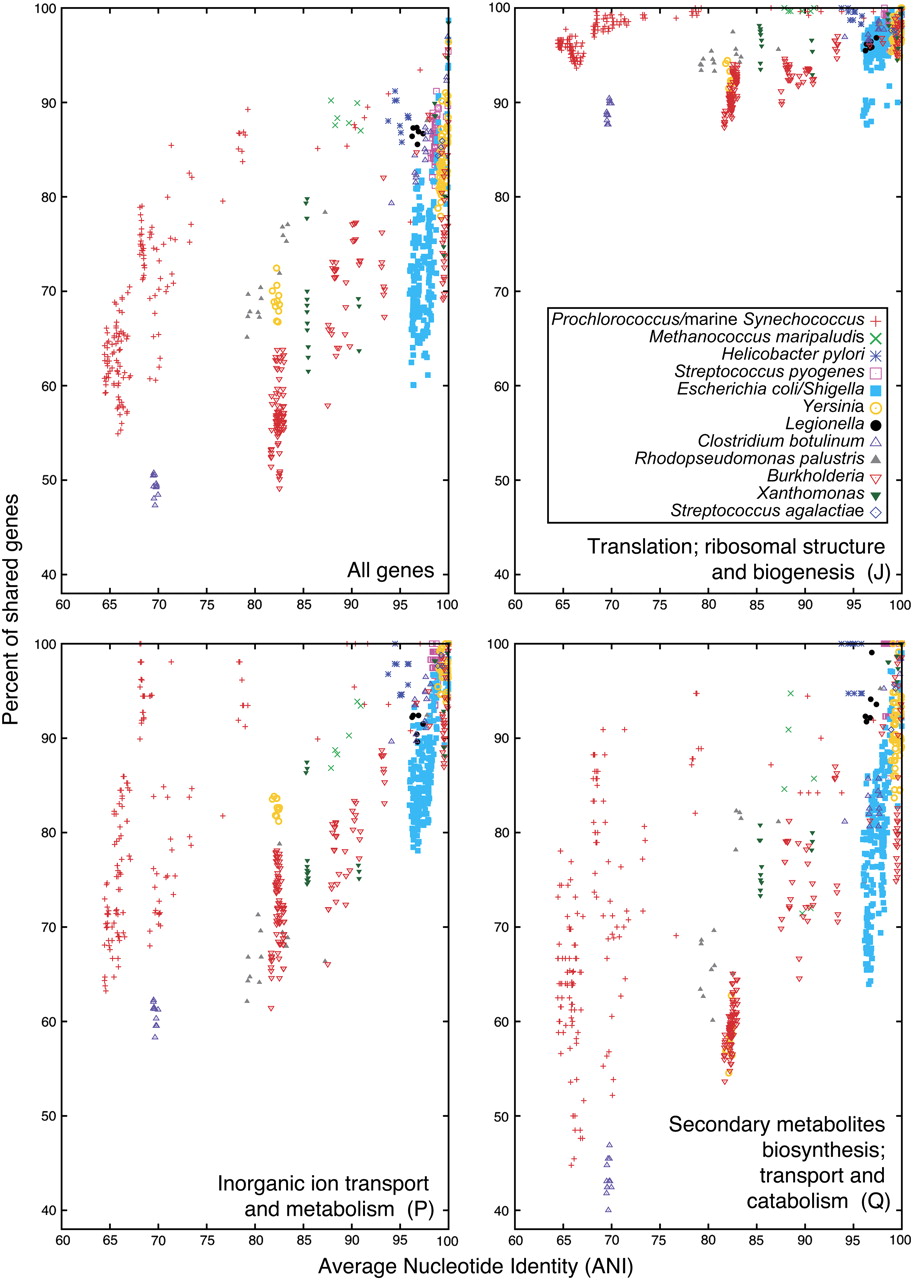
Comparison of average nucleotide identities (ANI) with gene content. 773 genomes available in NCBI's RefSeq database were initially clustered using 16S rRNA identity of at least 97% as a guide to form groups. A dozen clusters were selected (list of genomes within each cluster is available in Supplemental Table 1). For genomes within each cluster, pairwise ANI was calculated essentially as described in Konstantinidis and Tiedje (2005). Shared genes for each pair of genomes were identified as reciprocal top-scoring BLASTP matches (E-value < 0.001, z = 20,000,000). The proportion of shared genes was calculated as a ratio of the number of shared genes over the average number of genes in two genomes. Each ORF in a genome was assigned to a functional category according to the Clusters of Orthologous Groups (COG) database (August 2005 release), and three selected categories are depicted in this figure: categories J, P, and Q in COG category one-letter designation. Note that genomes of the E. coli/Shigella group have similar ANI values, but dramatically varying gene content. Some groups form tight clusters (e.g., Legionella spp.), while others exhibit a continuum of ANI/shared genes values (e.g., Burkholderia spp.). The clustering also exhibits a large variability in the number of shared genes if genes are considered by functional category.


