
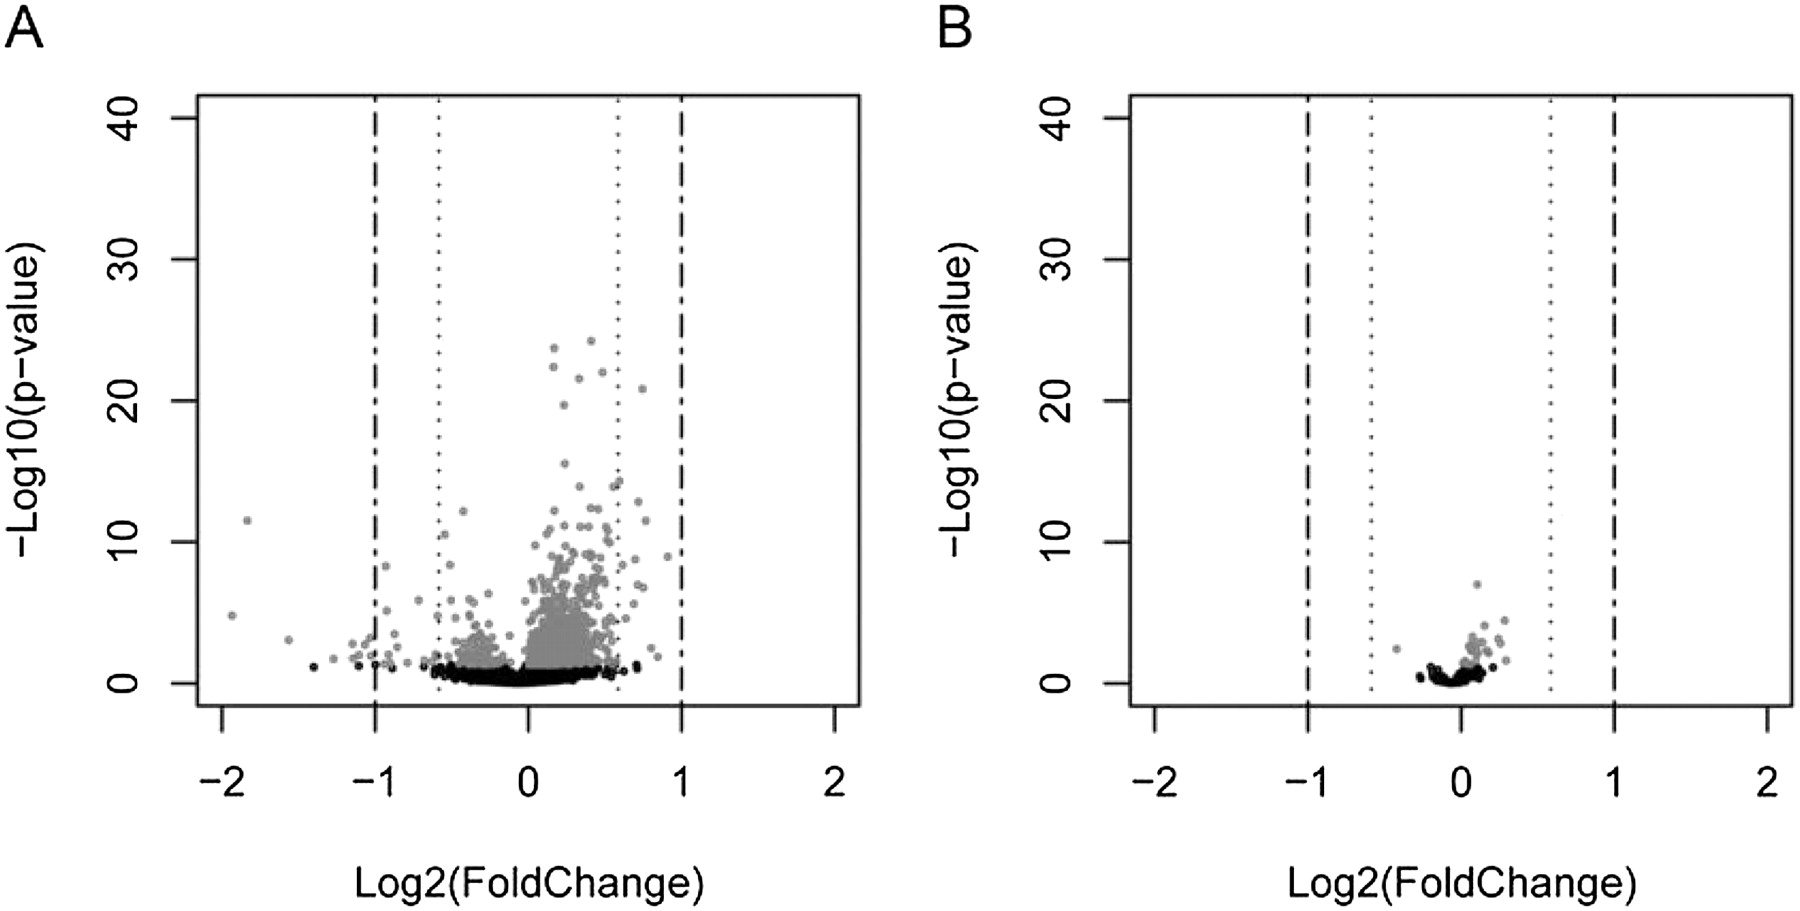
Figure 2.
Changes in gene expression with transgenic miR-310s (the “volcano” plots). The x-axis is the log2 value of fold change between the transgenic line and control. The dashed lines at ±0.585 and ±1 indicate relative expression changes of 33% and 50%, respectively. The y-axis is the log10 value of the likelihood of observing the change. (A) Whole-genome expression changes between miR-310s transgenic lines and the wild-type line. (B) Changes in the expression of the predicted targets between miR-310s transgenic lines and the wild-type line. Points of the lighter shade represent significantly misregulated genes.


