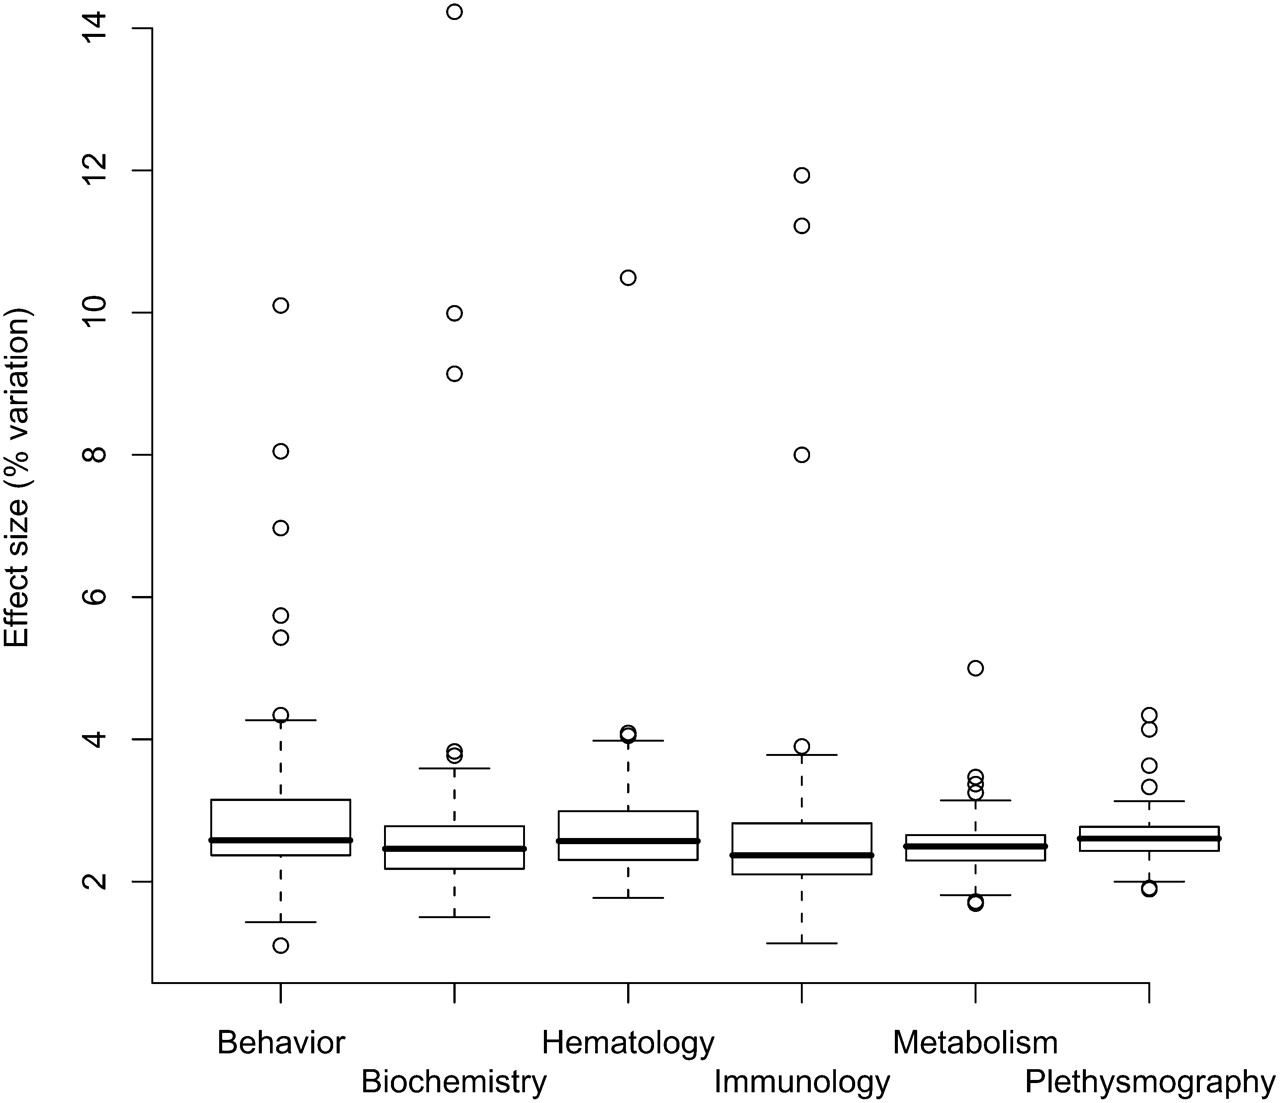
Genetic architecture of quantitative traits in mice, flies, and humans

(Downloading may take up to 30 seconds. If the slide opens in your browser, select File -> Save As to save it.)

Click on image to view larger version.

Figure 2.
Figure 2.

Effect sizes (expressed as percentage of total variation explained) for six categories of phenotype. Data are taken from analyses of 97 phenotypes mapped in heterogeneous stock mice (Valdar et al. 2006a).

This Article

  1. Genome Res. 19: 723-733

Preprint Server