
Figure 1.
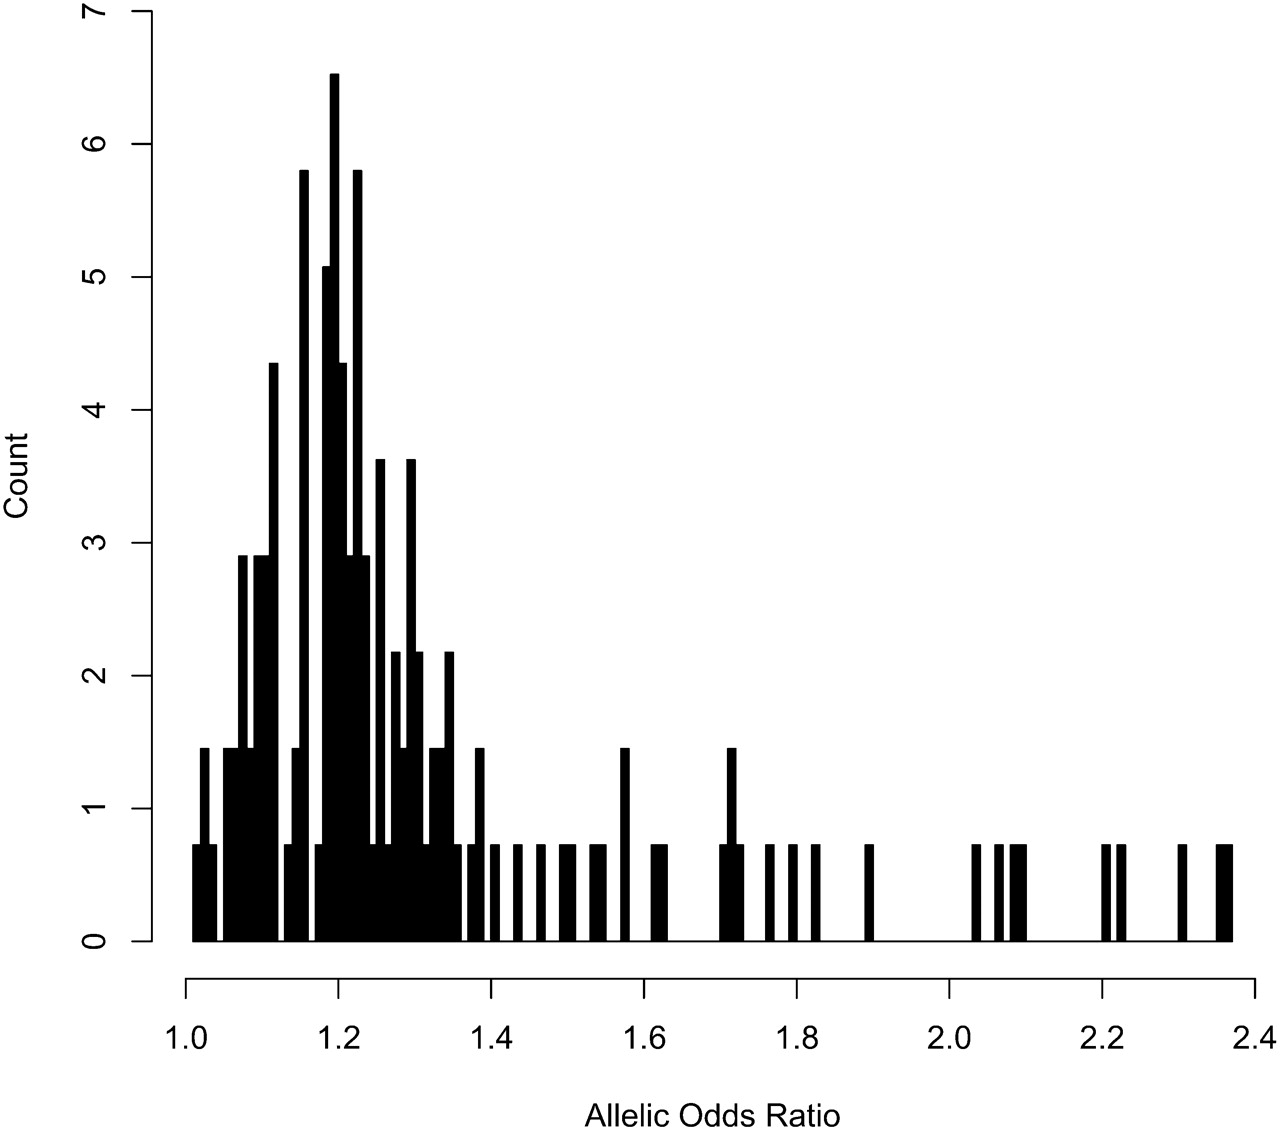
Effect sizes (expressed as odds ratios) in human genome-wide association studies. Data are from http://www.genome.gov/gwastudies/.
(Downloading may take up to 30 seconds. If the slide opens in your browser, select File -> Save As to save it.)
Click on image to view larger version.
Effect sizes (expressed as odds ratios) in human genome-wide association studies. Data are from http://www.genome.gov/gwastudies/.
 CiteULike
 Delicious
 Digg
Digg Facebook
 Google+
 Reddit
 Twitter
