
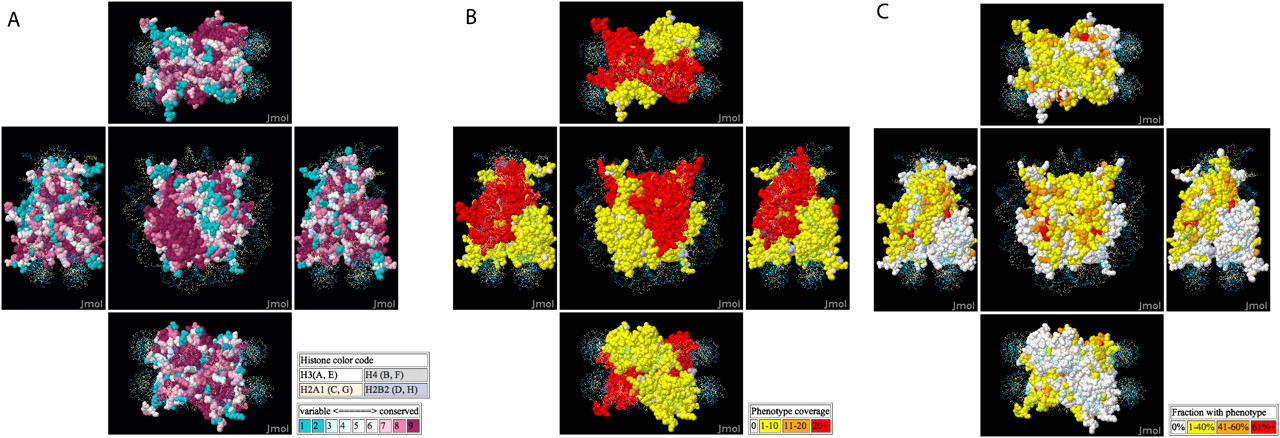
Figure 1.
A nucleosome crystal structure is colored according to evolutionary conservation scores (A), number of mutant/assay combinations tested (B), and the fraction of mutant/assay combinations giving a non-wild-type phenotype (C).


