
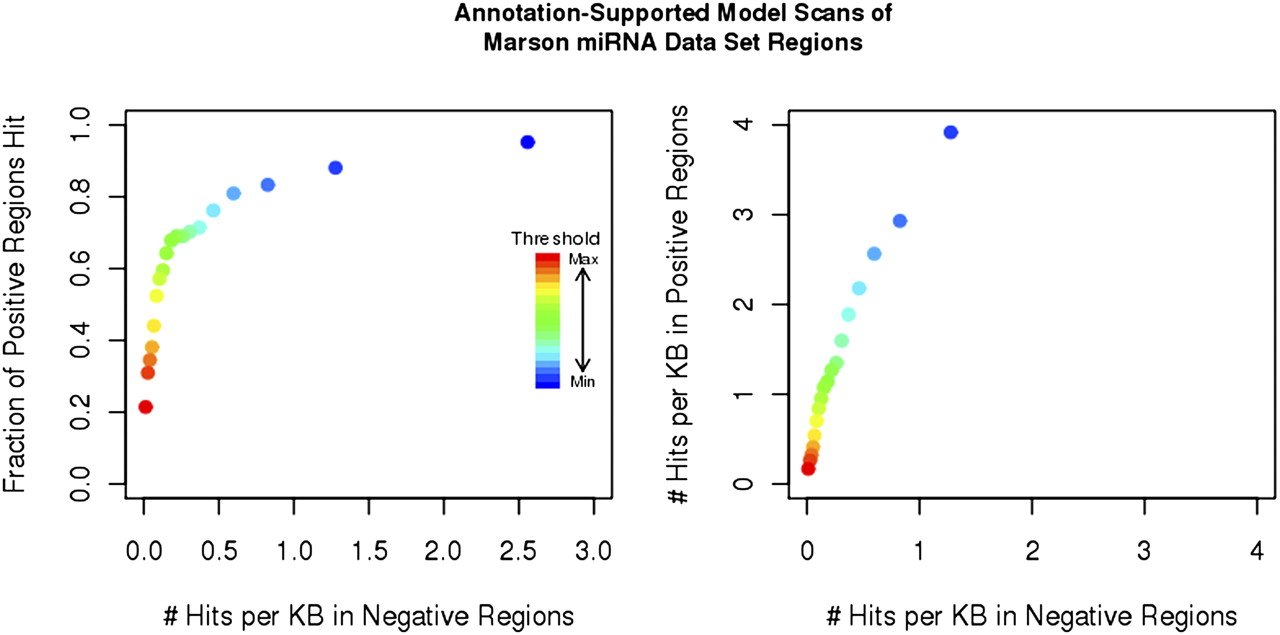
Figure 8.
Output of the annotation-supported model on the Marson putative miRNA TSS region data set. Each positive region is predicted by the Marson data set to contain one or more miRNA TSS, whereas negative regions are not predicted to contain any miRNA TSS. (Left) The curve compares the percentage of positive regions at each probability threshold (color) hit by an annotation-supported model probability peak to the number of hits per kilobase (hit density) within the negative regions. (Right) The curve compares hit density within the positive regions to hit density within the negative regions.


