
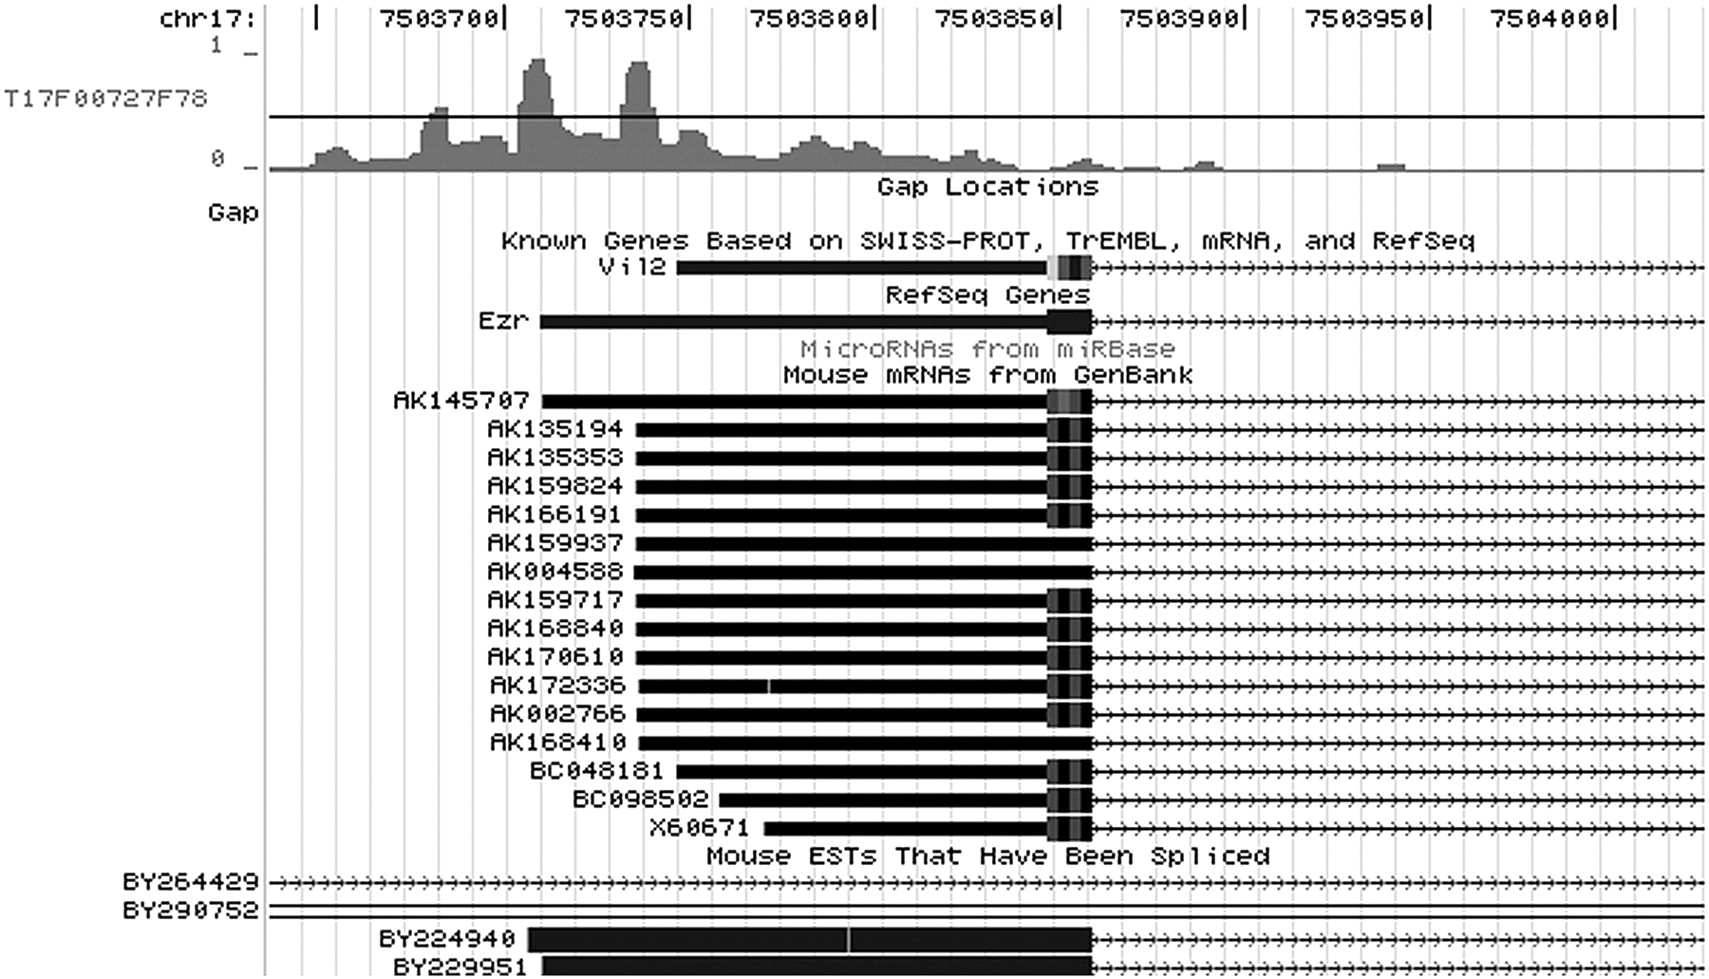
Figure 6.
At the top, the UCSC custom track displays probability output from a representative scan over the region of a test set TSS using the annotation-supported model (this particular example shows CAGE tag cluster T17F00727F78). The model calls out highly probable single-peak start regions with surprising accuracy, often indicating additional possible single-peak starts in locations that are supported by mRNA transcripts from GenBank.


