
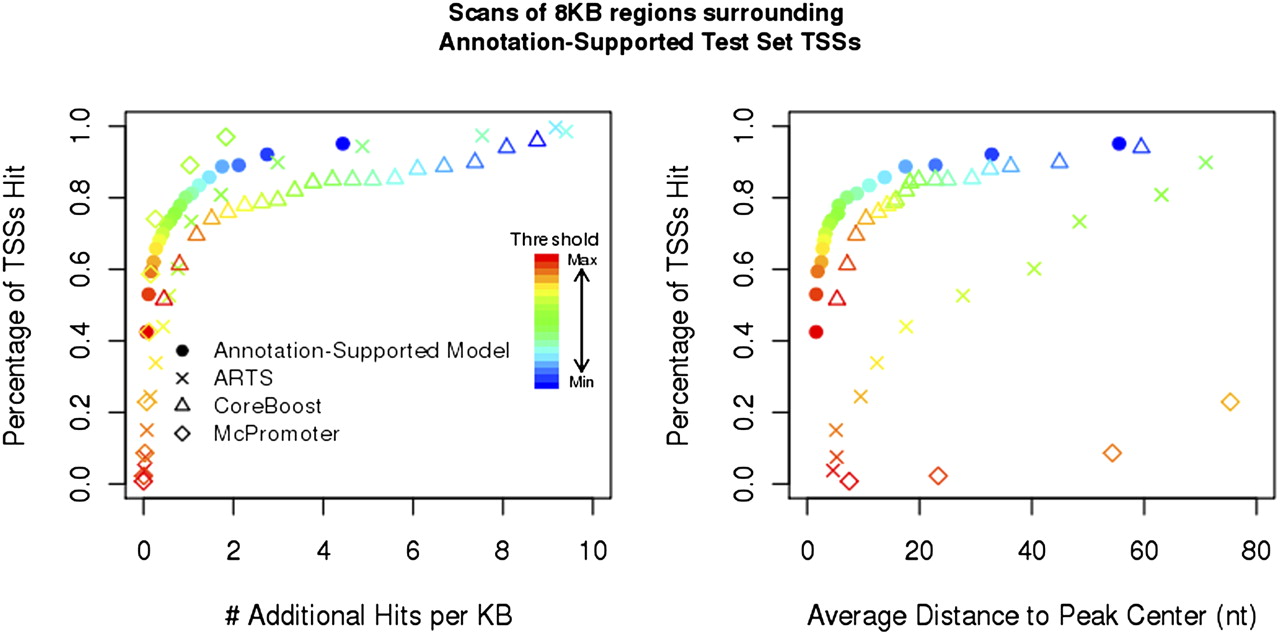
Figure 5.
Performance on scans of the annotation-supported test set. (Left) The case in which a TSS is considered to be a hit if a probability peak contains the TSS. The curve represented by each symbol type shows the percentage of TSS hit as a function of the number of additional hits per kilobase. (Right) Each curve displays the average distance to the center of the probability peak computed over all of the peaks containing a TSS. At each threshold value (color), the plots give a comparative view of how many additional peaks are being called versus how well the TSS-containing peaks approximate actual TSS location.


