
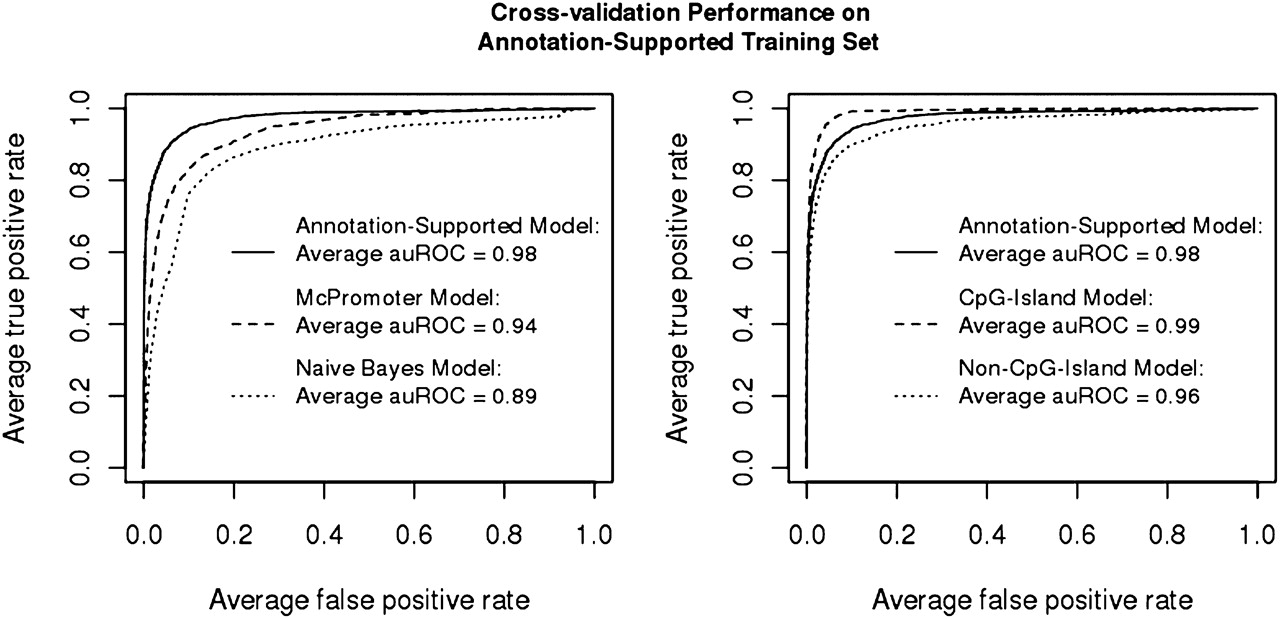
Figure 4.
Tenfold cross-validation performance comparisons for the annotation-supported model. (Left) The plot compares the performance of two additional classifiers, a näive Bayes classifier and McPromoter's HMM classifier. (Right) The plot compares CpG-island and non-CpG-island models. ROC curves with threshold averaging are displayed in both plots, along with the average area under the curve (auROC). Positive examples are the experimentally supported CAGE single-peak TSS locations, while negative examples are selected from intergenic and coding regions (see Fig. 3B).


