
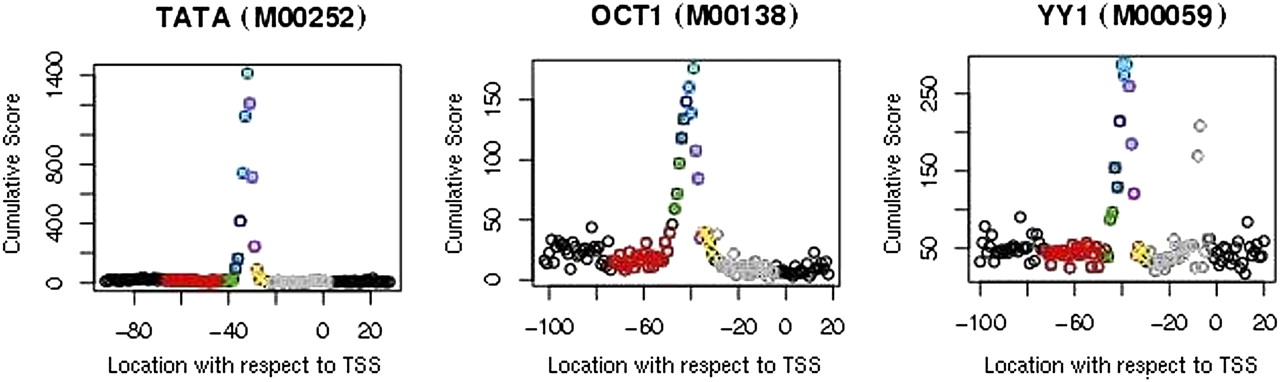
Figure 2.
Regions of positional enrichment with respect to TSS for TF-binding elements TATA, OCT1, and YY1. TRANSFAC ID for each binding element is displayed in plot titles. Plots display cumulative score (summed over the annotation-supported training set TSS regions) for each element as a function of position with respect to TSS. Colors show the region subdivisions diagrammed in Figure 3A. (Red and gray) Flanking regions.


