
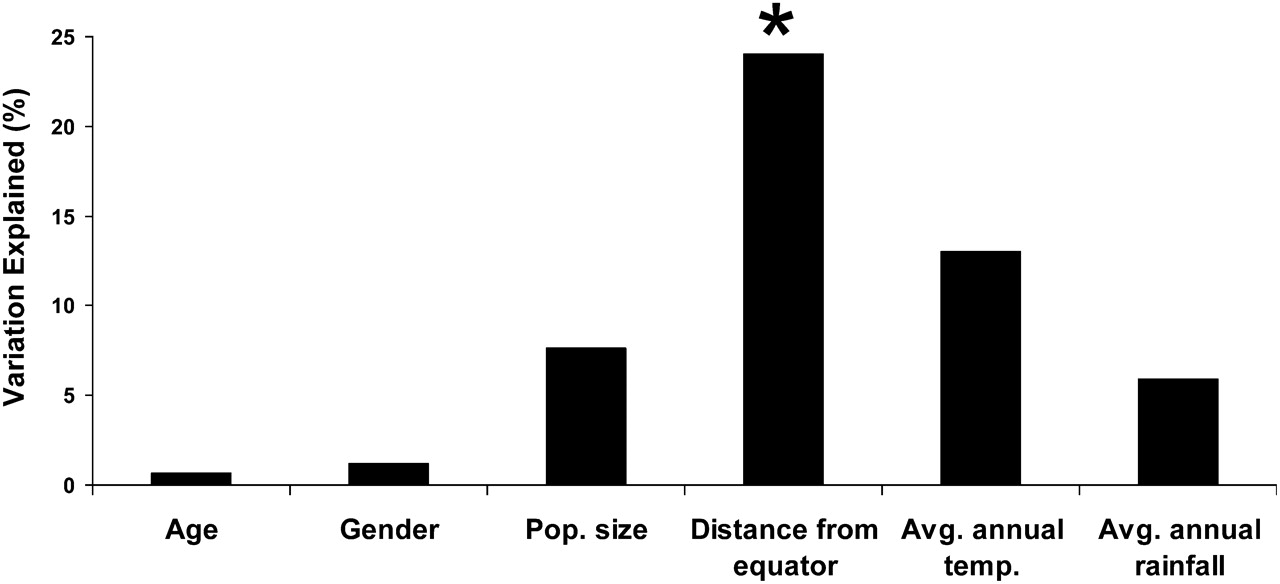
Figure 5.
Amount of variation explained (in percent) in the FST distances among individuals (for the age and gender of the donors), and in the UniFrac distances among locations (for the variables population size, distance from the equator, average annual temperature, and average annual rainfall) (Supplemental Table S15). There is a significant association between the UniFrac distances and the variable “Distance from Equator” (P = 0.006).


