
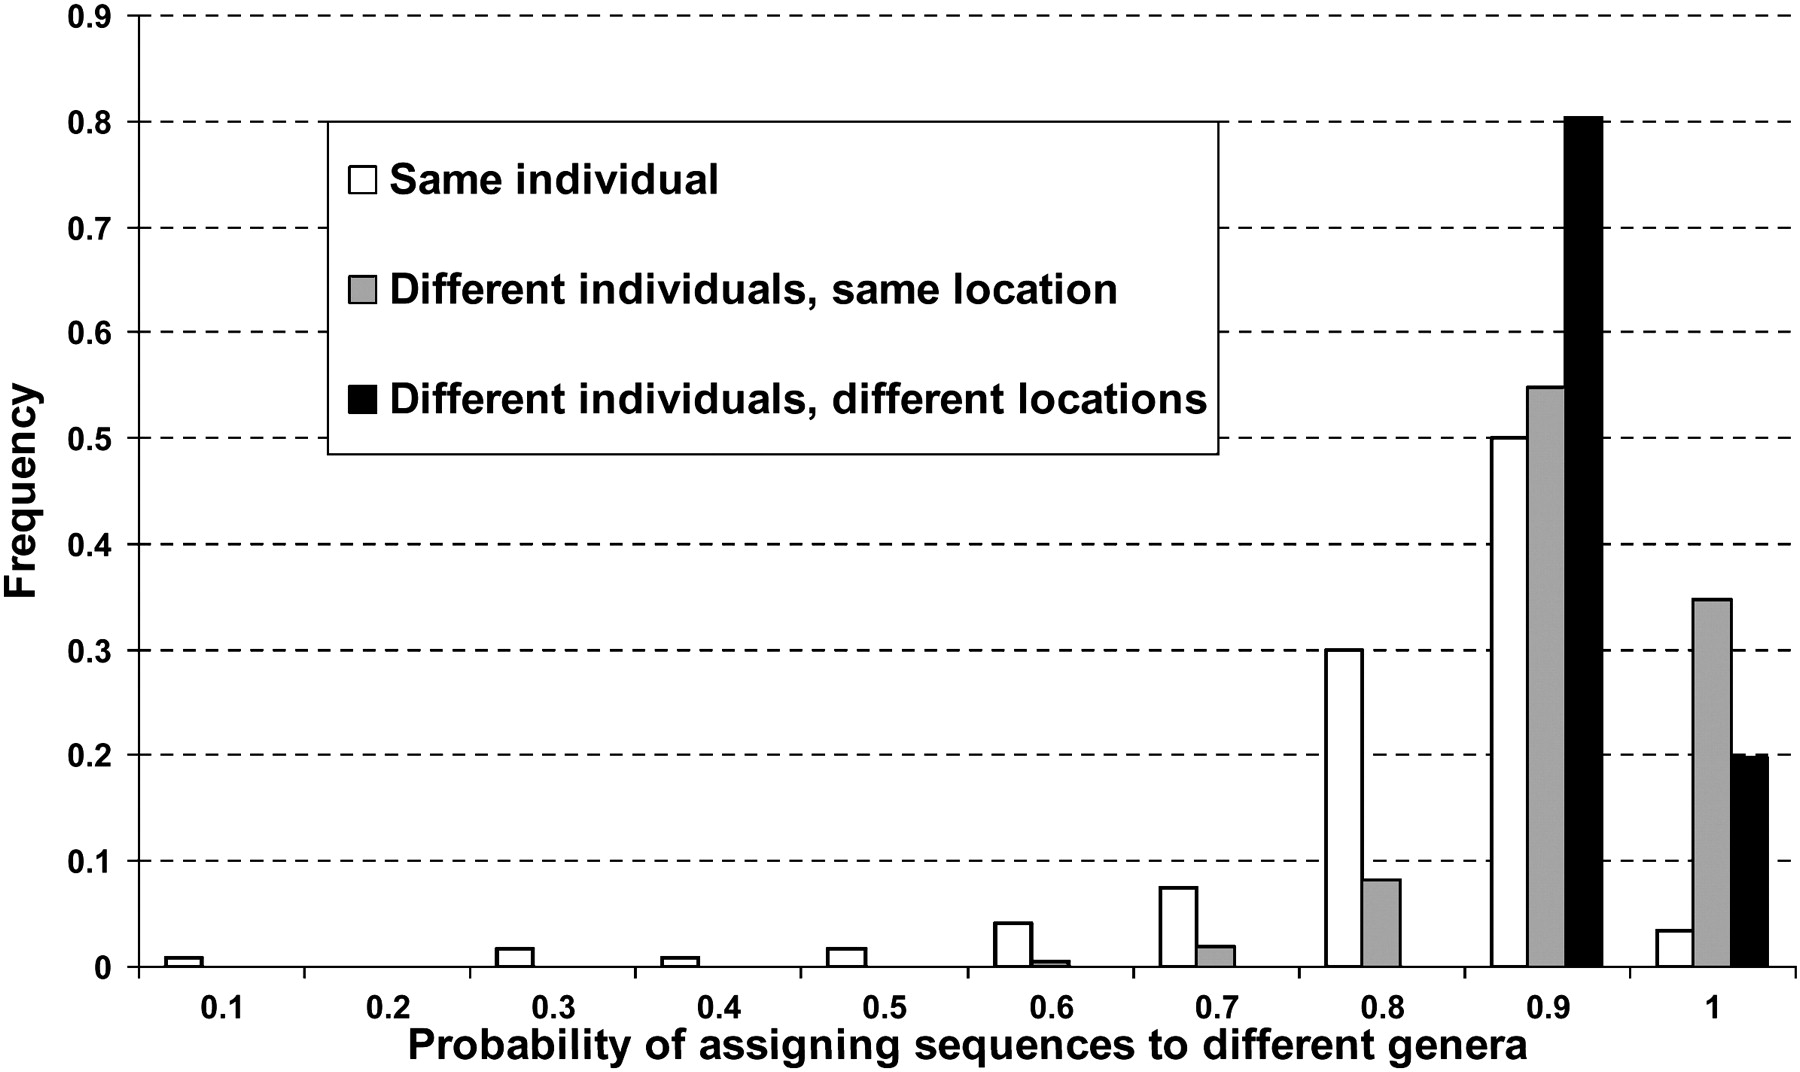
Figure 3.
Frequency distribution of the probability that two sequences will be assigned to different genera when drawn from the same individual (values are for each of the 120 individuals); different individuals from the same location (values are for all pairwise comparisons of the 10 individuals from the same location, for all 12 locations); and different individuals from different locations (values are for all pairwise comparisons of the 12 locations).


