
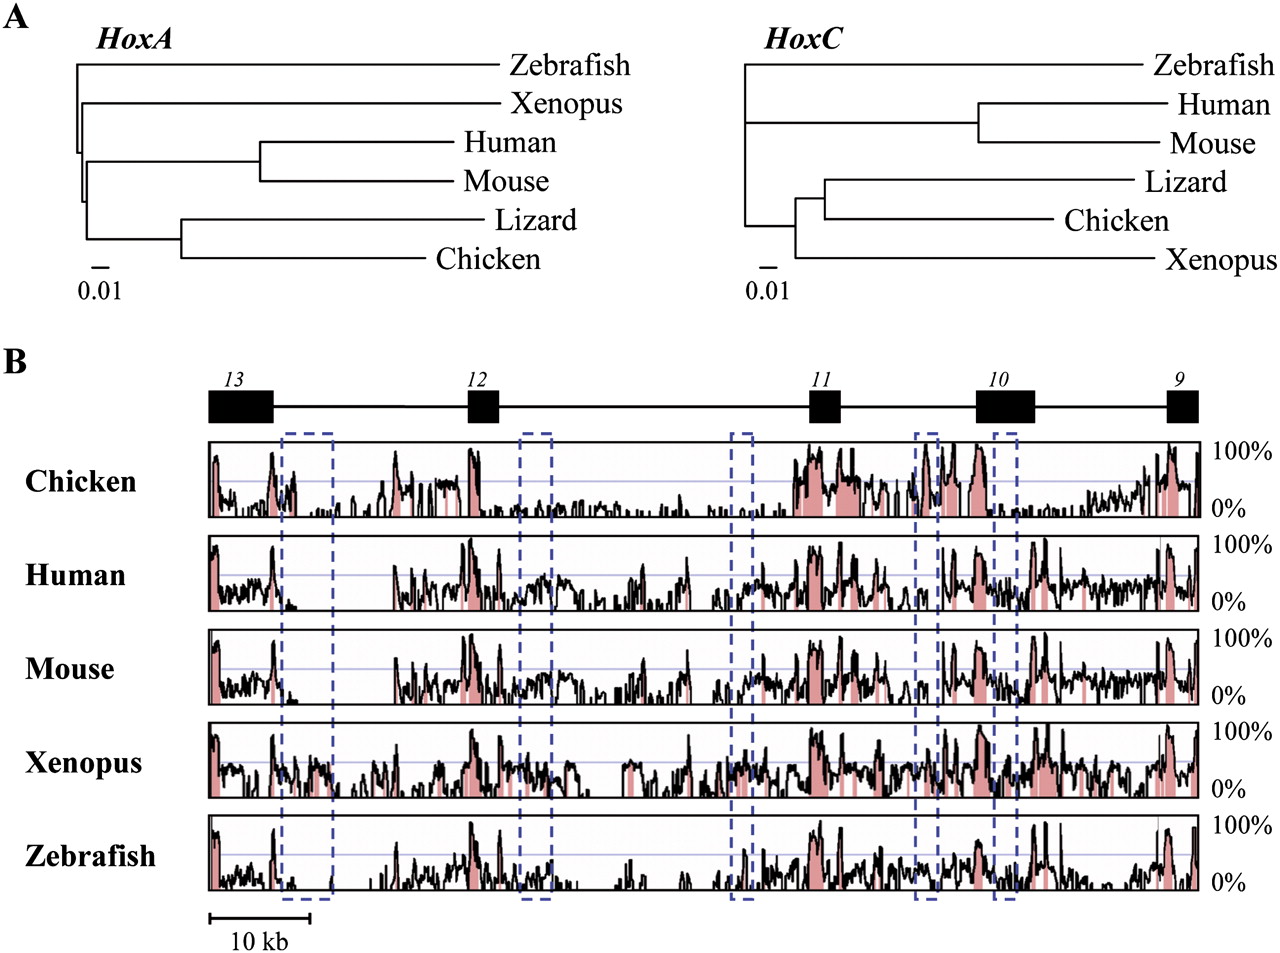
Sequence comparison of vertebrate HoxA and HoxC clusters. (A) Phylogenetic tree of some vertebrate HoxA (left) and HoxC (right) clusters, using the neighbor-joining method and the zebrafish Hox cluster as outgroup. To include the chicken sequence in this study, only the posterior part of the HoxC cluster (from Hoxc13 to Hoxc9) was used. Branch lengths are proportional to the number of nucleotide substitutions per site. (B) Global sequence alignment of lizard, chicken, human, mouse, Xenopus, and zebrafish HoxC clusters. Sequence comparisons were carried out using the indicated lizard HoxC cluster region (from Hoxc13 to Hoxc9, common to all vertebrates) as a reference sequence. Exons of the respective Hox genes are indicated above the black boxes. Nucleotidic homologies relative to the lizard sequence are given by histogram peaks. (Red peaks) Significant nucleotide homology. (Blue dashed boxes) Conserved elements between lizard and Xenopus (with >60% identity), yet not recognizable in mammals.


