
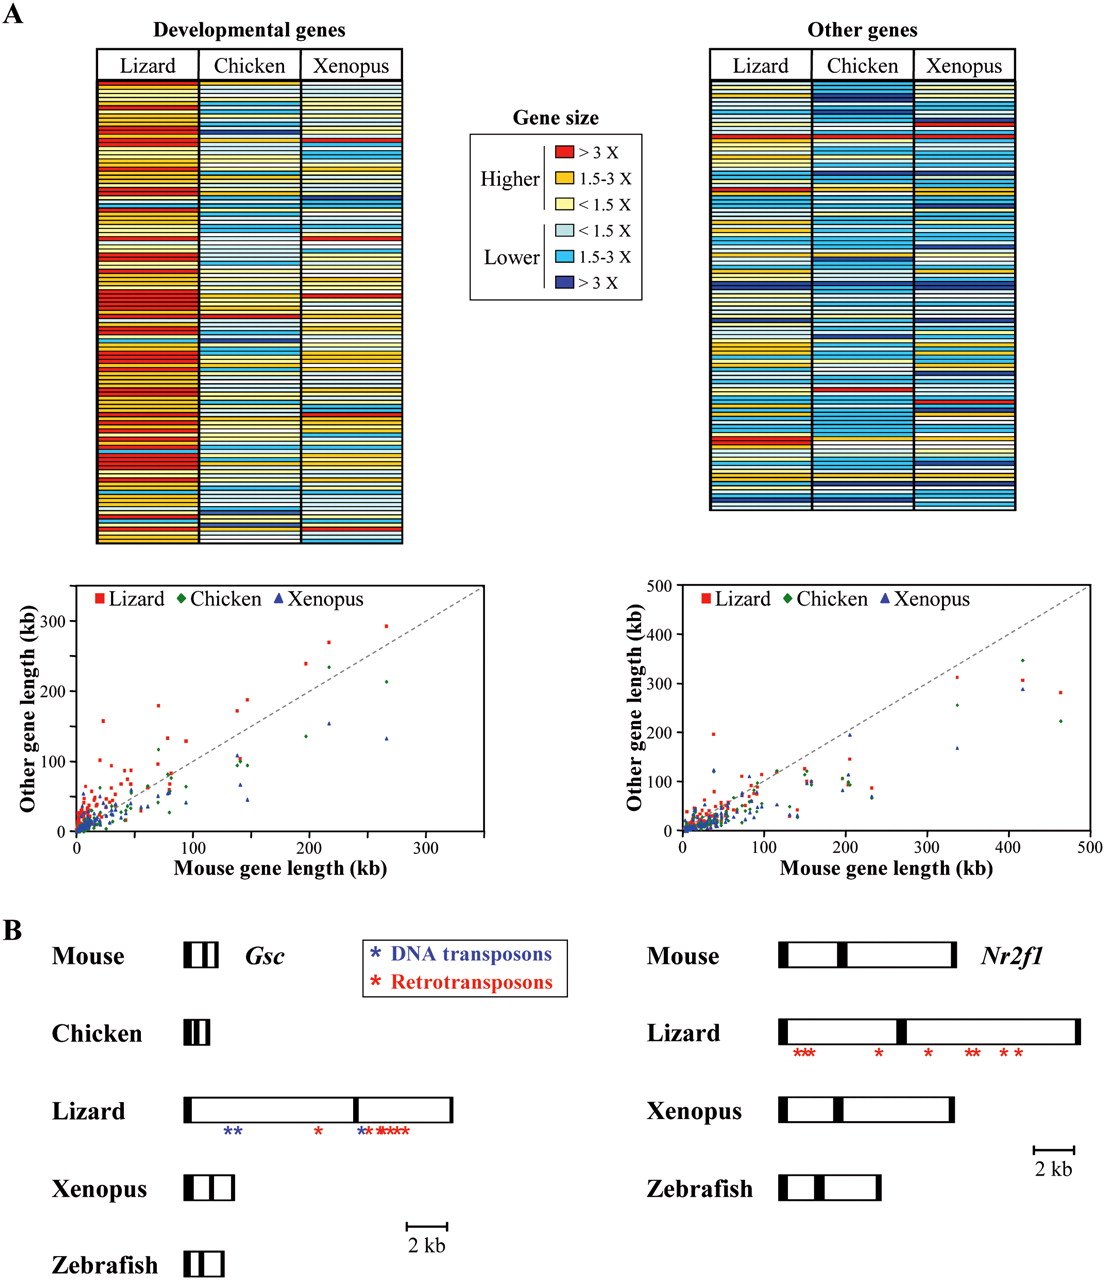
Distribution of gene sizes (lengths), either for genes with a known developmental-specific function, or without. (A, top panel) The relative lengths of developmental-specific genes and their non-developmental-specific flanking genes in lizard, chicken, and Xenopus are compared with their mouse counterparts and expressed as a ratio to mouse gene size. In order to compare exact orthologous genomic regions between vertebrates, the analysis includes both full-length and portions of genes. (Increasing red color intensity) An increasing gene size, as compared with the mouse size reference; (blue color intensity) a reduction in gene size. (Bottom panels) The distribution of developmental-specific (left) and nondevelopmental-specific (right) gene sizes between the mouse and other vertebrates. (B) Comparison of Gsc (left) and Nr2f1 (right) gene structures in some vertebrates. The correct relative sizes of predicted exons (black boxes) and introns (white boxes) allows for direct size comparisons between the various vertebrates. The locations of intronic transposons (blue asterisks) and non-LTR retrotransposons (red asterisks) within lizard genes are indicated.


