
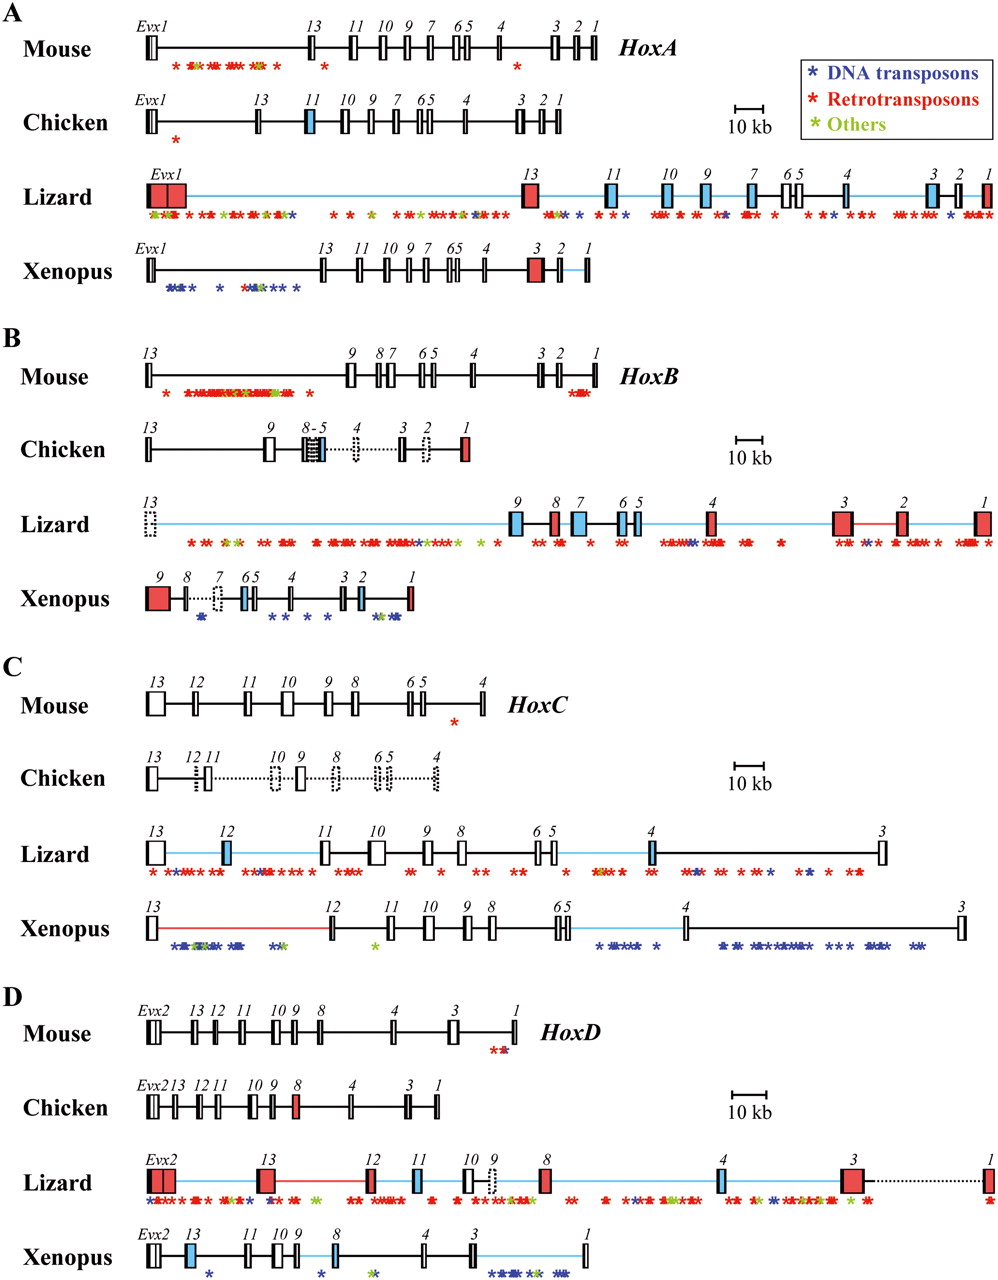
Genomic organization of vertebrate Hox clusters. Schematic representation of: (A) HoxA, (B) HoxB, (C) HoxC, and (D) HoxD clusters in mouse, lizard, chicken, and Xenopus. The annotated relative sizes of predicted exons (black boxes), introns (white or colored boxes), and intergenic regions (thick lines) for both Hox and Evx genes allows for direct size comparisons between vertebrates. Gene names are shown above each box. Colors indicate either a 1.5-fold to threefold increase (blue), or a more than threefold increase (red), either in intronic (colored boxes) or intergenic (colored lines) distances. Gaps into the genomic sequences are indicated by dotted lines for intergenic regions and dotted boxes for coding regions. (C) Note the poor sequence coverage of the HoxC cluster in chicken and the presence of Hoxc3 in both lizard and Xenopus. The positions of interspersed repeats along the clusters are indicated by asterisks of different colors, reflecting the major classes of repetitive elements: (blue) DNA transposons; (red) LTR as well as non-LTR retrotransposons; (green) other conserved repeats.


