
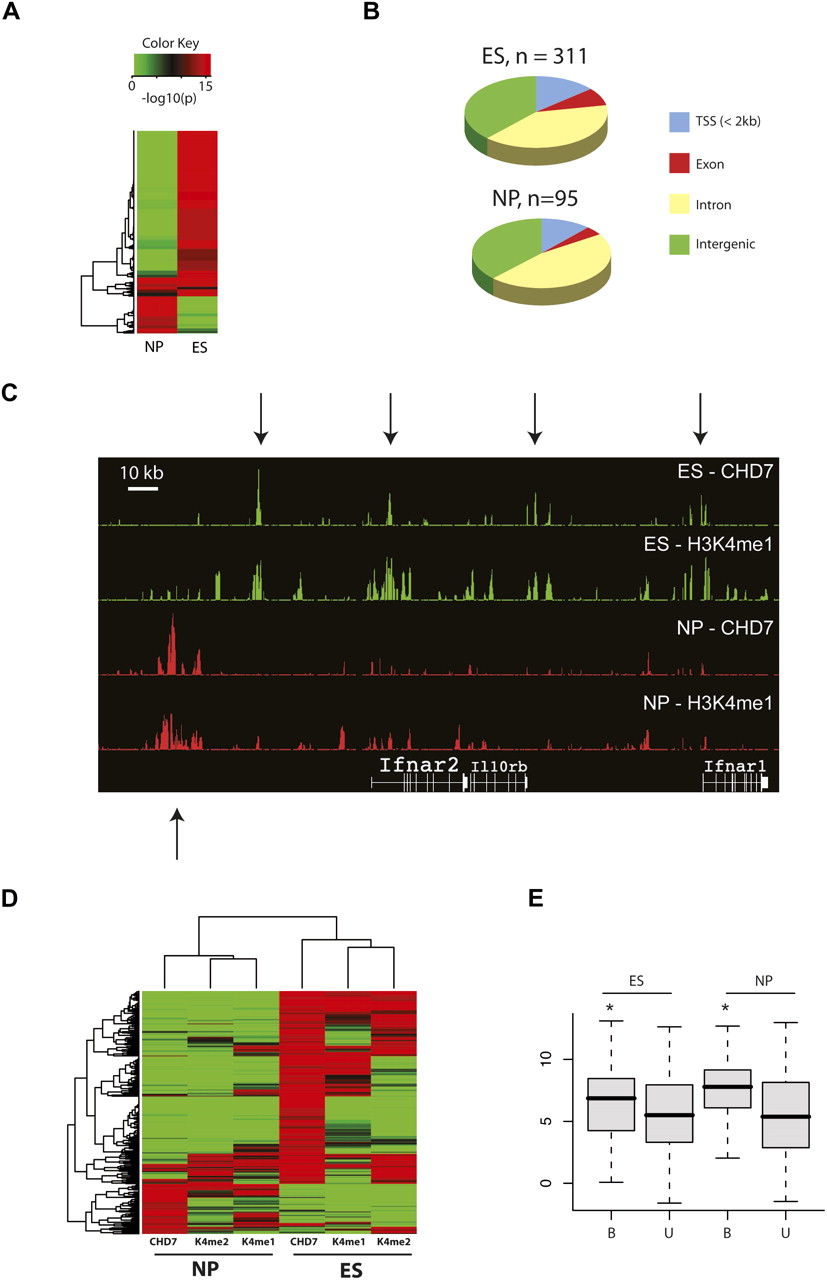
Characterization of CHD7 sites in ES and NP cells. (A) Heat map of P-values corresponding to CHD7 ChIP-chip signal intensities in ES and NP cells. (B) Pie charts showing distribution of CHD7 sites with respect to RefSeq genes in regions of the mouse genome that are orthologous to the human ENCODE regions. (C) CHD7 and H3K4me1 ChIP-chip profiles in ES and NP cells. (D) Heat map of P-values corresponding to CHD7, H3K4me1, and H3K4me2 ChIP-chip signals in ES and NP cells. (E) Average expression of genes within 10 kb of a CHD7 site (B) and greater than 10 kb from a CHD7 site (U) in ES and NP cells. The asterisk denotes significant differences as determined by Wilcoxon test (ES P = 0.03, NP P = 0.02).


