
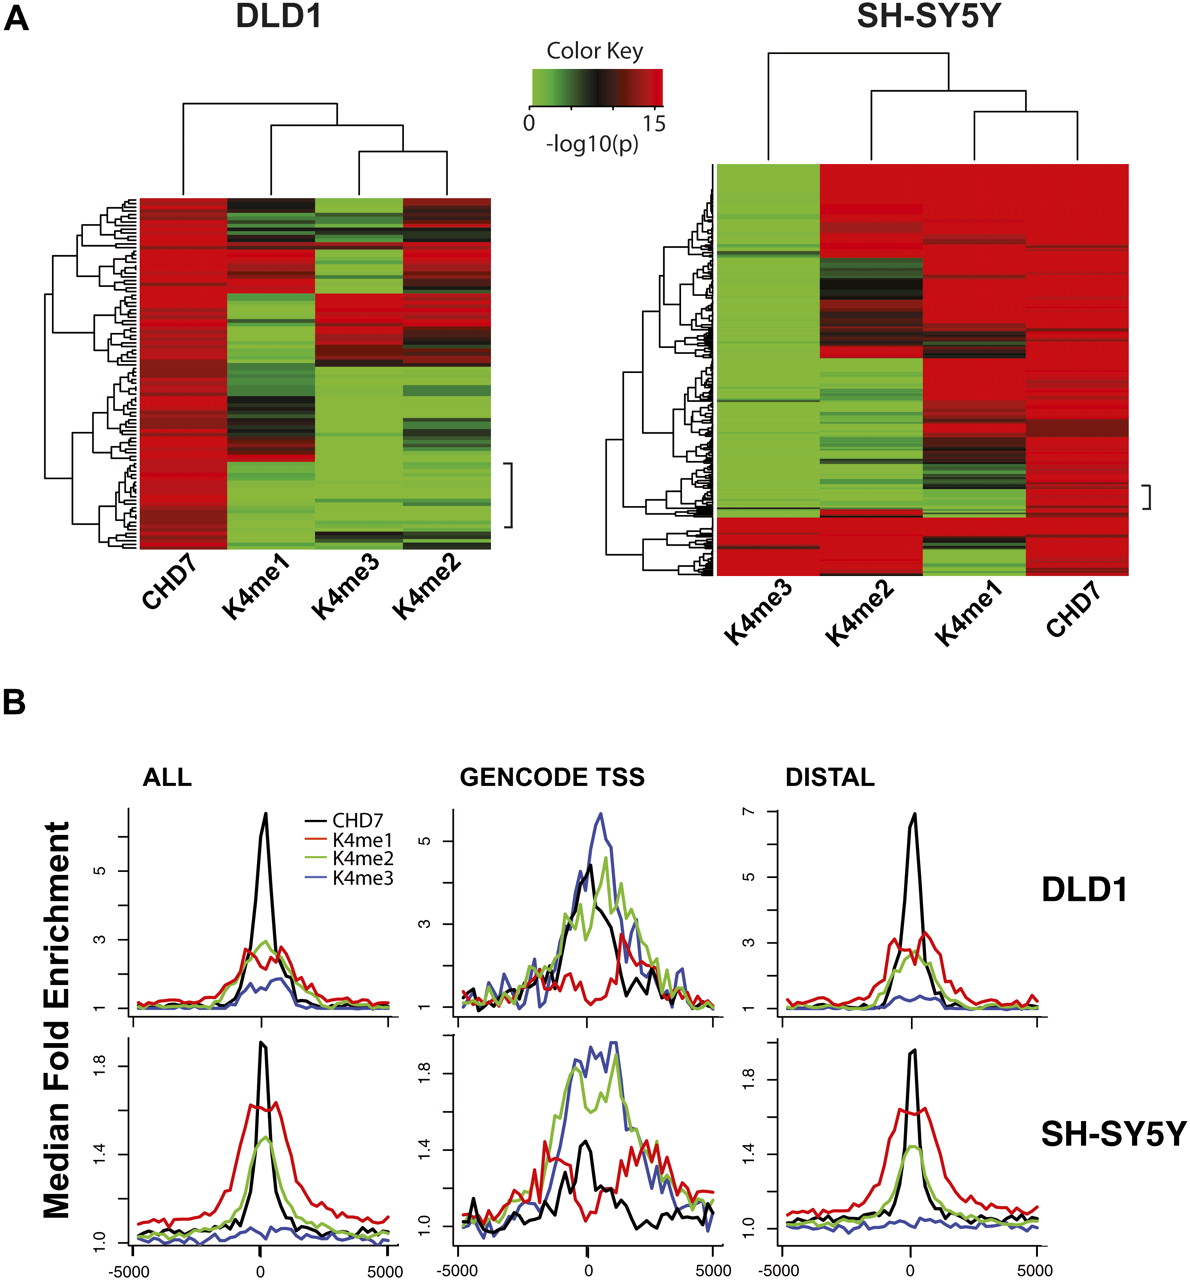
Comparison of CHD7 and H3K4 methylation patterns. (A) Heat maps illustrating the overlap of CHD7 and K4 mono-, di-, and trimethylation across 6 ENCODE regions (left) in DLD1 cells and all 44 ENCODE regions in SH-SY5Y cells (right), respectively. The regions denoted by the side brackets harbor low levels of H3K4me1 that are apparent at lower significance thresholds. (B) Aggregate plots of ChIP-chip signals. Raw ChIP-chip data from each cell line were quantile normalized. The median signal intensity of CHD7 peaks (from −5 to +5 kb with respect to the center of the peak) was then calculated and plotted, along with signal intensities for mono-, di-, and trimethyl K4 at the equivalent regions in both DLD1 (top left) and SH-SY5Y cells (bottom left). This was repeated for CHD7 sites located at GENCODE transcription start sites (center) and distal CHD7 sites (right).


