
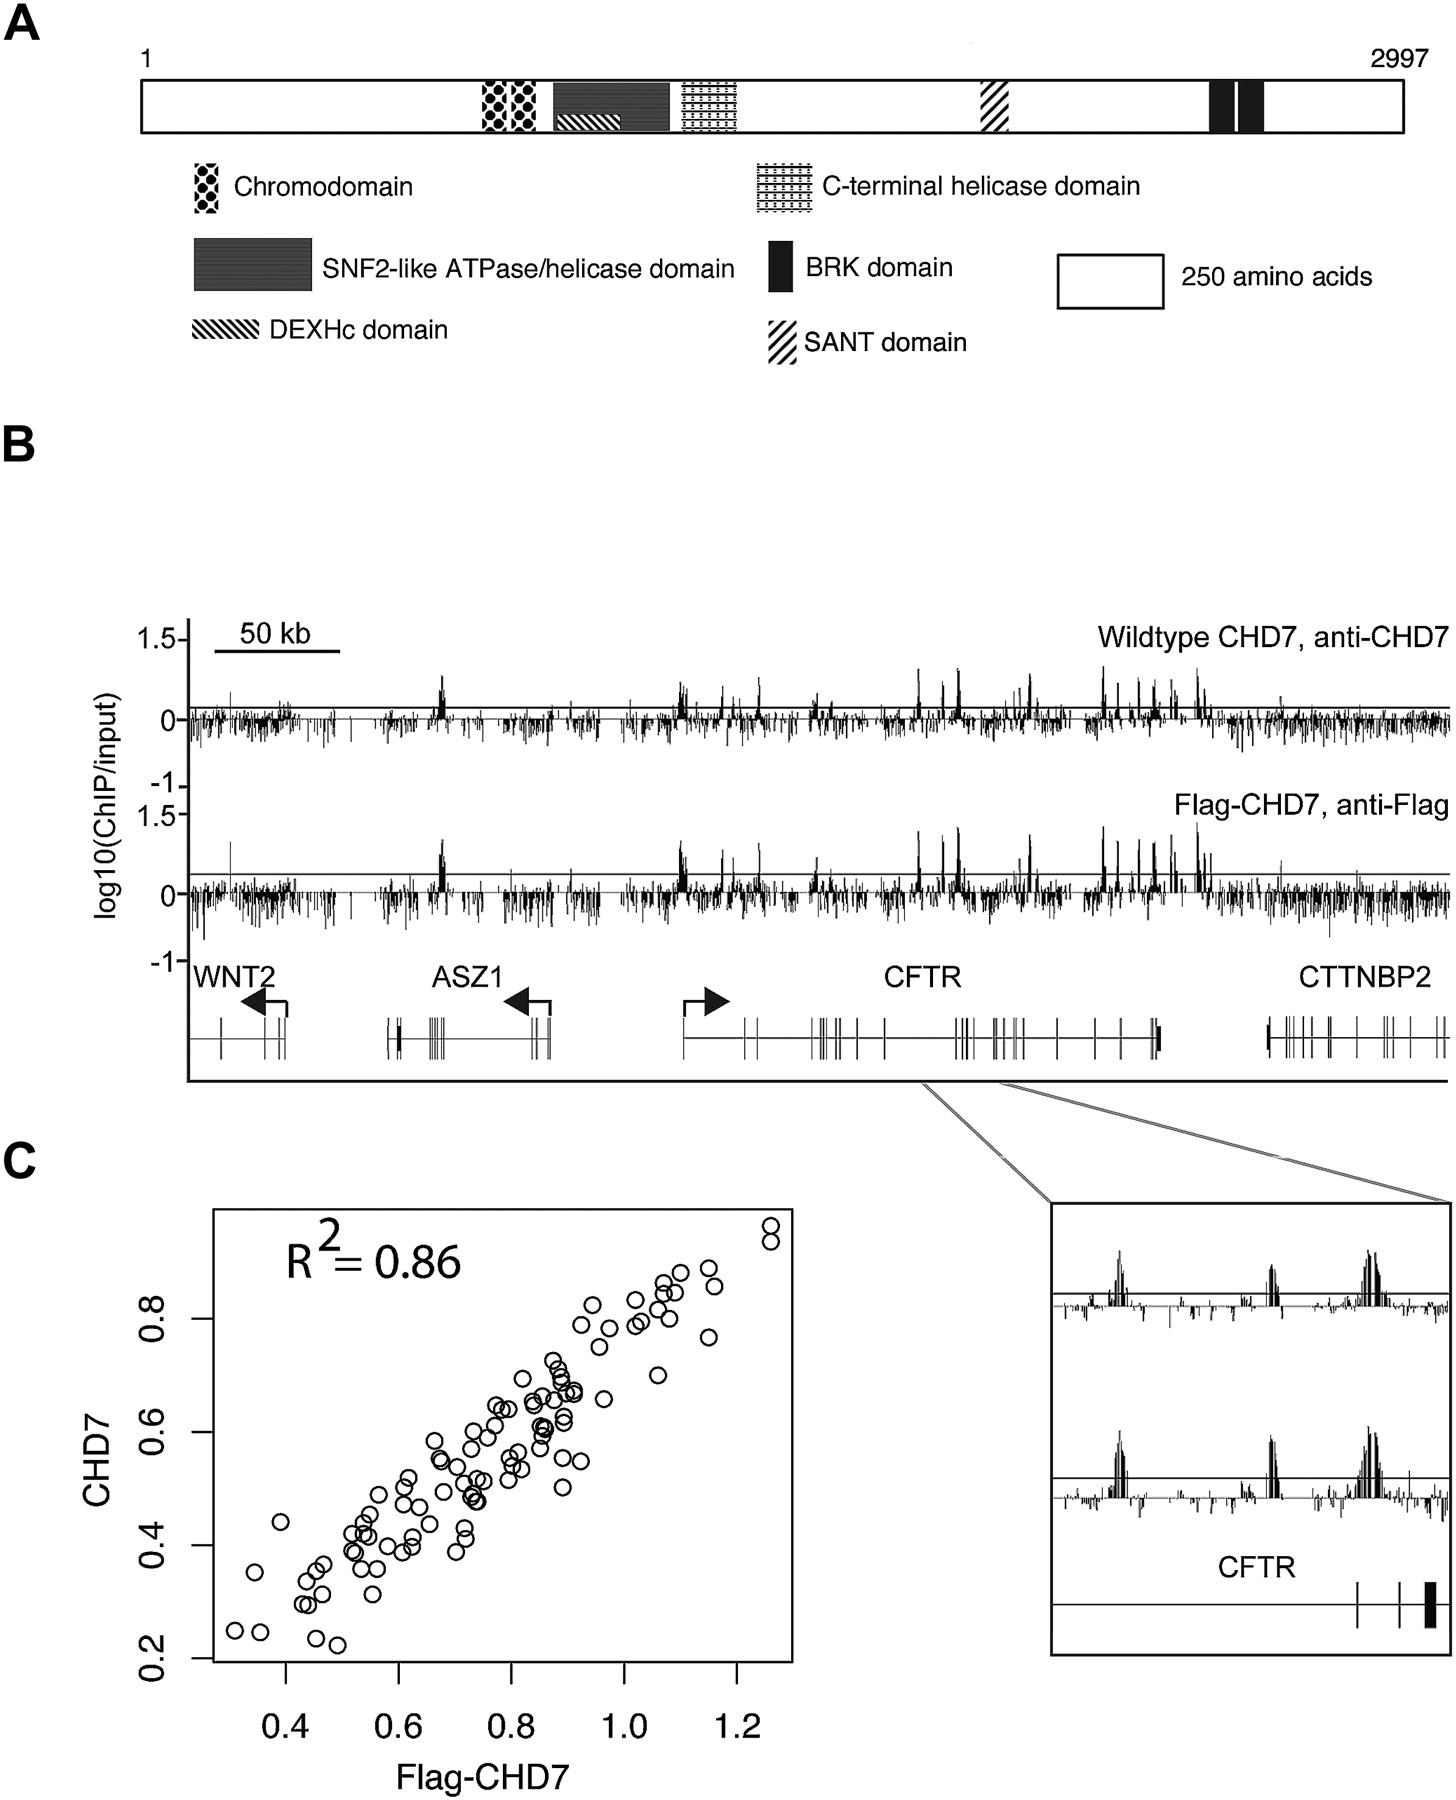
CHD7 binds to specific sites on chromatin. (A) Structure of CHD7. (B) ChIP-chip analysis of wild-type and Flag-tagged CHD7 in DLD1 cells. CHD7 binding profiles from a 500-kb region on chromosome 7. Median raw ratio data of three biological replicates from the indicated ChIP-Chip experiments are plotted, along with the relative locations of known genes and their transcriptional orientation (arrows). The top 5% is displayed as a horizontal gray line. An expanded view of three positive signals along the CFTR gene is shown below. (C) The maximum signal intensity ratios for each CHD7 occupied site in CHD7 and Flag ChIP-chip experiments are plotted on the y- and x-axes, respectively (n = 96).


