
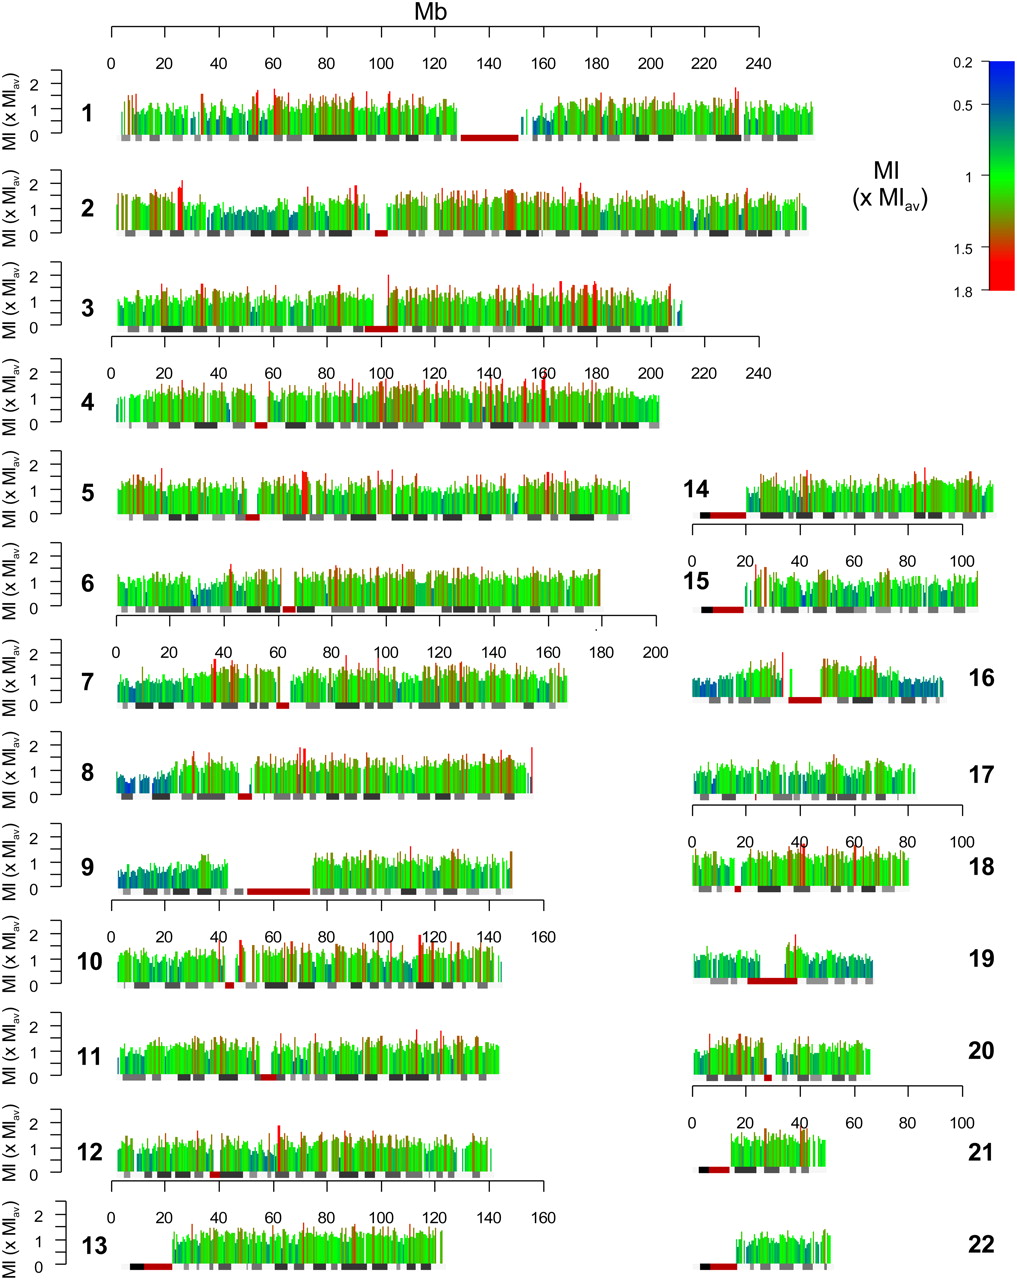
Figure 1.
A genome-wide map of human germline methylation. A methylation index (MI) was calculated for each 500 kb of genomic sequence with satisfactory data (no gaps in sequencing and at least 20 known SNPs). The y-axis value and bar color (see color index) demonstrate methylation as the ratio of average genome MI (MIav).


