
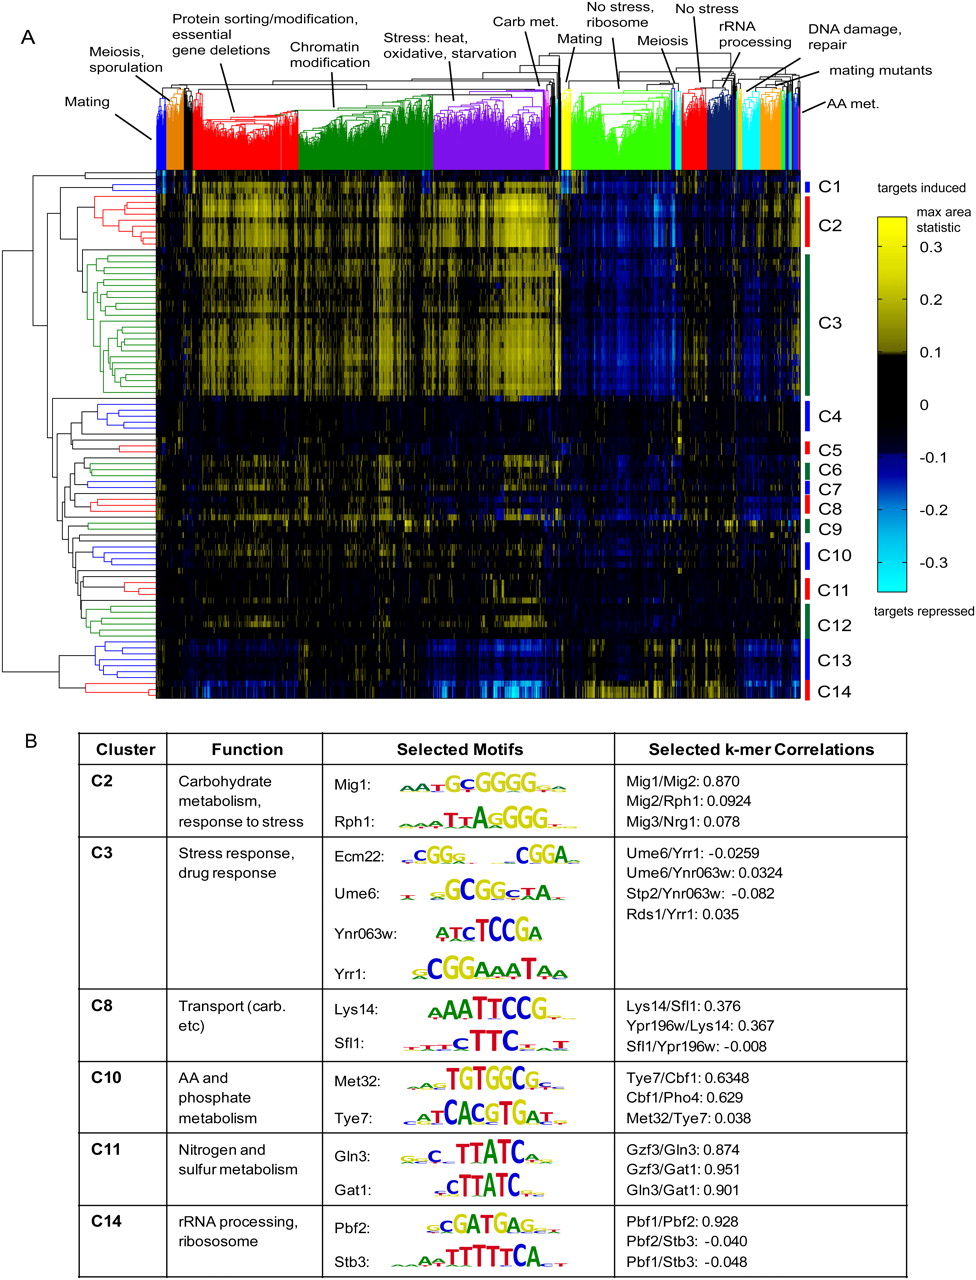
Figure 5.
Analysis of TFs' regulatory associations and coregulatory factors. (A) Two-dimensional hierarchical clustering of 89 TFs (rows) according to their CRACR statistics across 1693 expression conditions (columns). (B) Examples of predicted coregulatory TFs from A with distinct motifs, and their 8-mer binding profile correlations. Clusters annotations are derived from the literature and functional predictions from this study. A high-resolution heatmap with full labeling is available in Supplemental Fig. S11, S12.


