
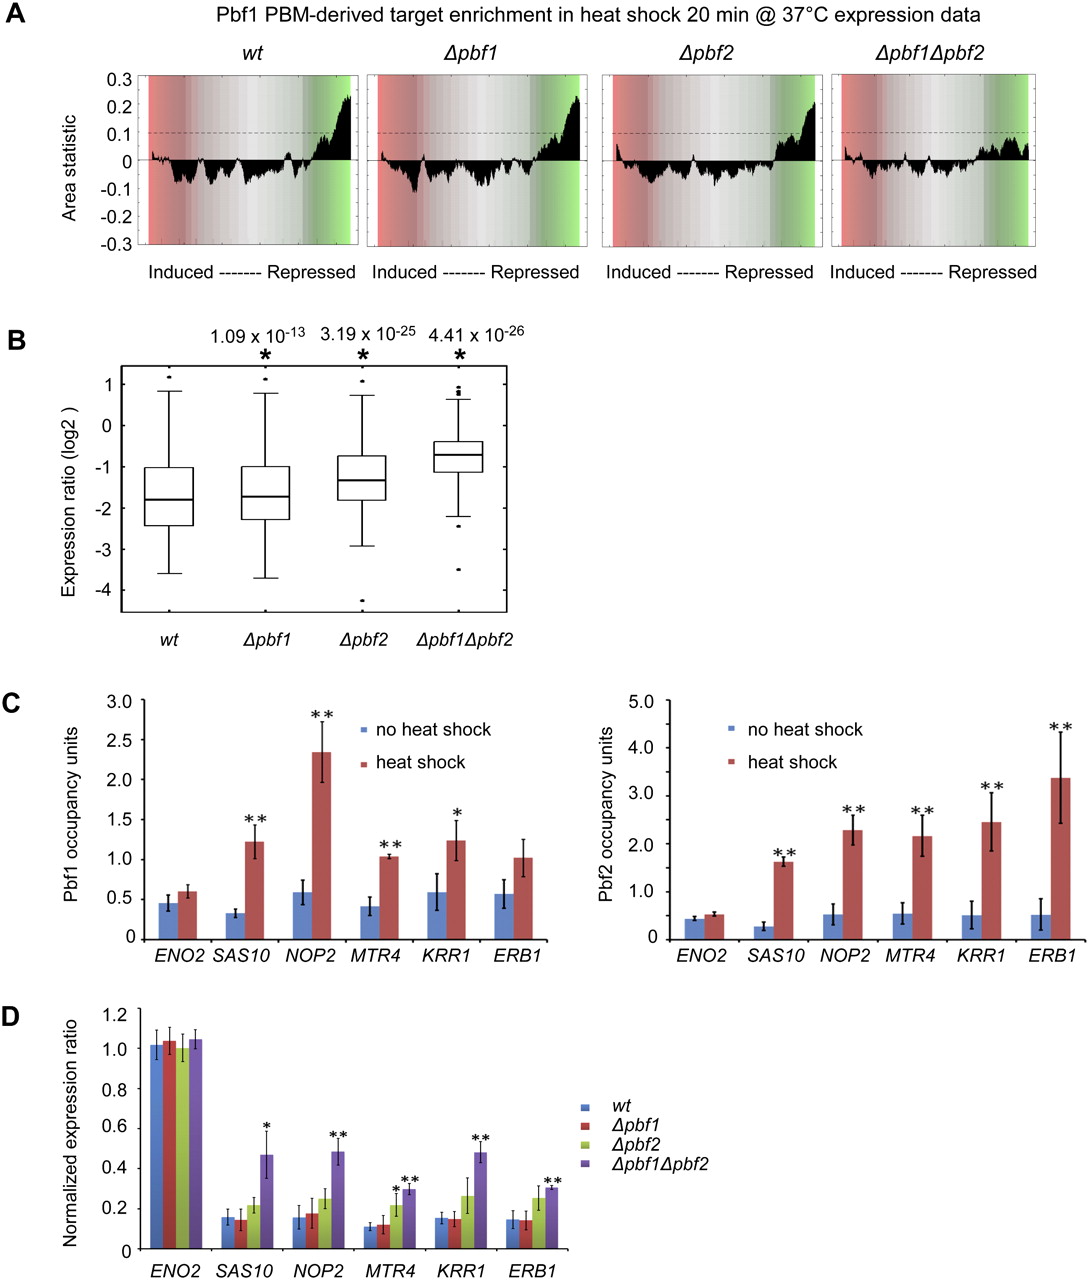
Pbf1 and Pbf2 regulate rRNA processing genes. (A) Predicted target genes of Pbf1 and Pbf2 are significantly repressed (CRACR P < 10−12) after 20 min heat shock (shift from 25°C to 37°C) in wild-type, Δpbf1, and Δpbf2 strains, but not in the Δpbf1Δpbf2 double deletion strain, in Affymetrix gene expression profiling of triplicate biological replicate cultures. (B) Box plots indicating expression changes of rRNA processing genes containing at least one k-mer at E ≥ 0.45 after 20 min heat shock in wild-type, Δpbf1, Δpbf2, and Δpbf1Δpbf2 strains, in the expression data from A. (C) Pbf1 and Pbf2 associate in vivo with the promoter regions of the rRNA processing genes SAS10, NOP2, MTR4, KRR1, and ERB1. ChIP-qPCR was performed on cells treated with 5-min heat shock, at predicted target sites in their upstream regions, and at a negative control region upstream of ENO2. Binding fold-enrichment was defined as the ratio of PCR product in “IP” versus “INPUT,” using an open reading frame free region on chromosome V as an internal normalization control. Error bars indicate 1 SD from triplicate biological replicate cultures (*P < 0.05; **P < 0.01; two-sided Student's t-test). (D) Expression ratio of rRNA processing genes after heat shock. RT-qPCR data were generated for either untreated yeast or yeast treated with 20-min heat shock. Gene expression was normalized relative to ACT1 as an internal normalization control. Error bars indicate 1 SD from triplicate biological replicate cultures (*P < 0.05; **P < 0.01; two-sided Student's t-test compared with wild type).


