
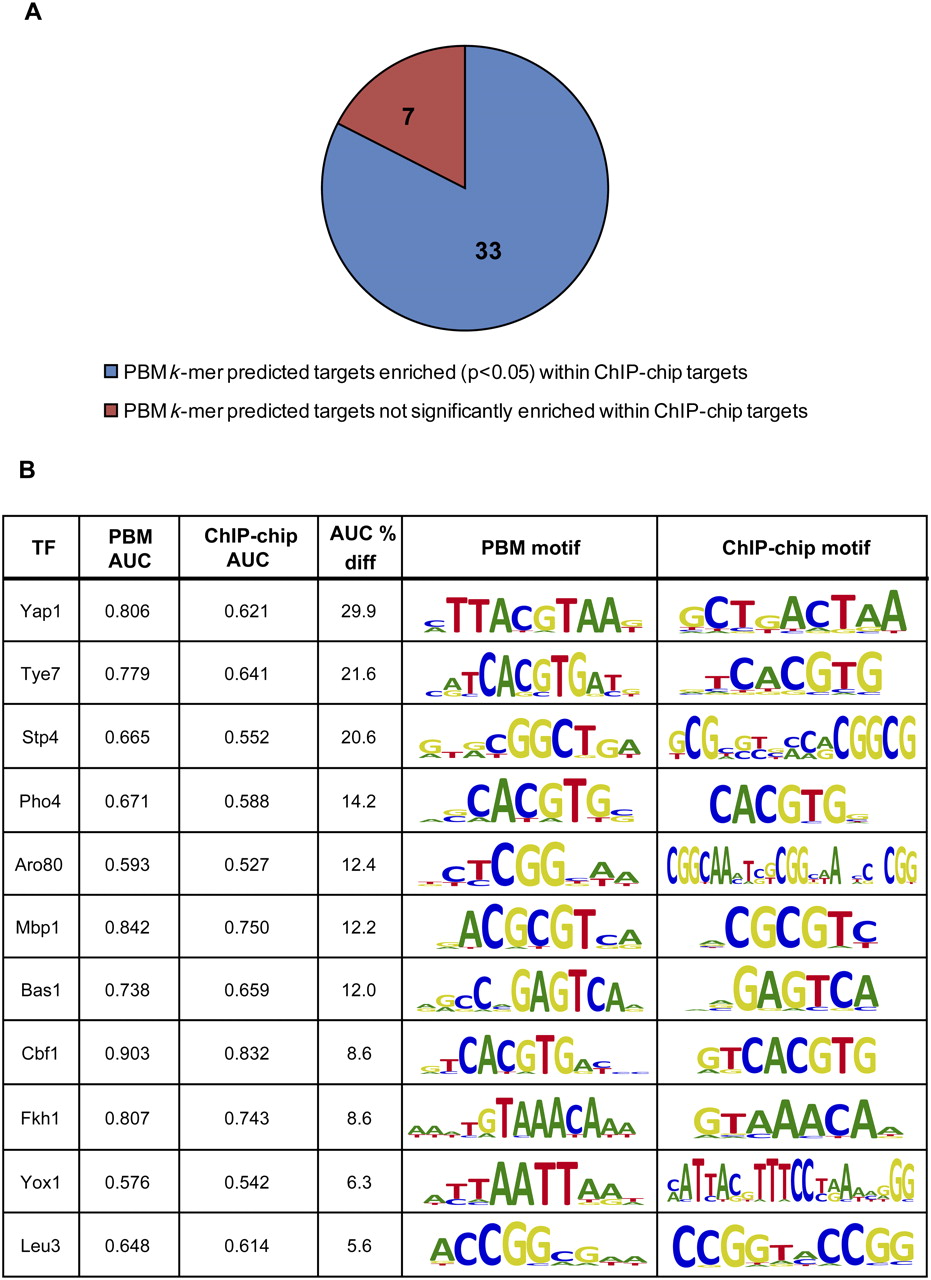
PBM k-mer binding profiles in most cases correspond well with ChIP-chip binding data. (A) For 33 of the 40 TFs for which we had both PBM- and ChIP-chip-derived motifs (Harbison et al. 2004), the PBM k-mer-derived potential targets were significantly enriched (AUC > 0.5, P < 0.05) among the ChIP-chip “bound” regions, showing good agreement between the ChIP-chip in vivo data and our scoring of genes based on the in vitro PBM k-mer data. (B) For 11 out of 40 TFs, intergenic regions scored by the PBM 8-mer data are more highly enriched (>5% improvement in AUC; all PBM AUC P-values are <0.05) among the ChIP-chip “bound” regions as compared with those scored by the ChIP-chip-derived motif.


