
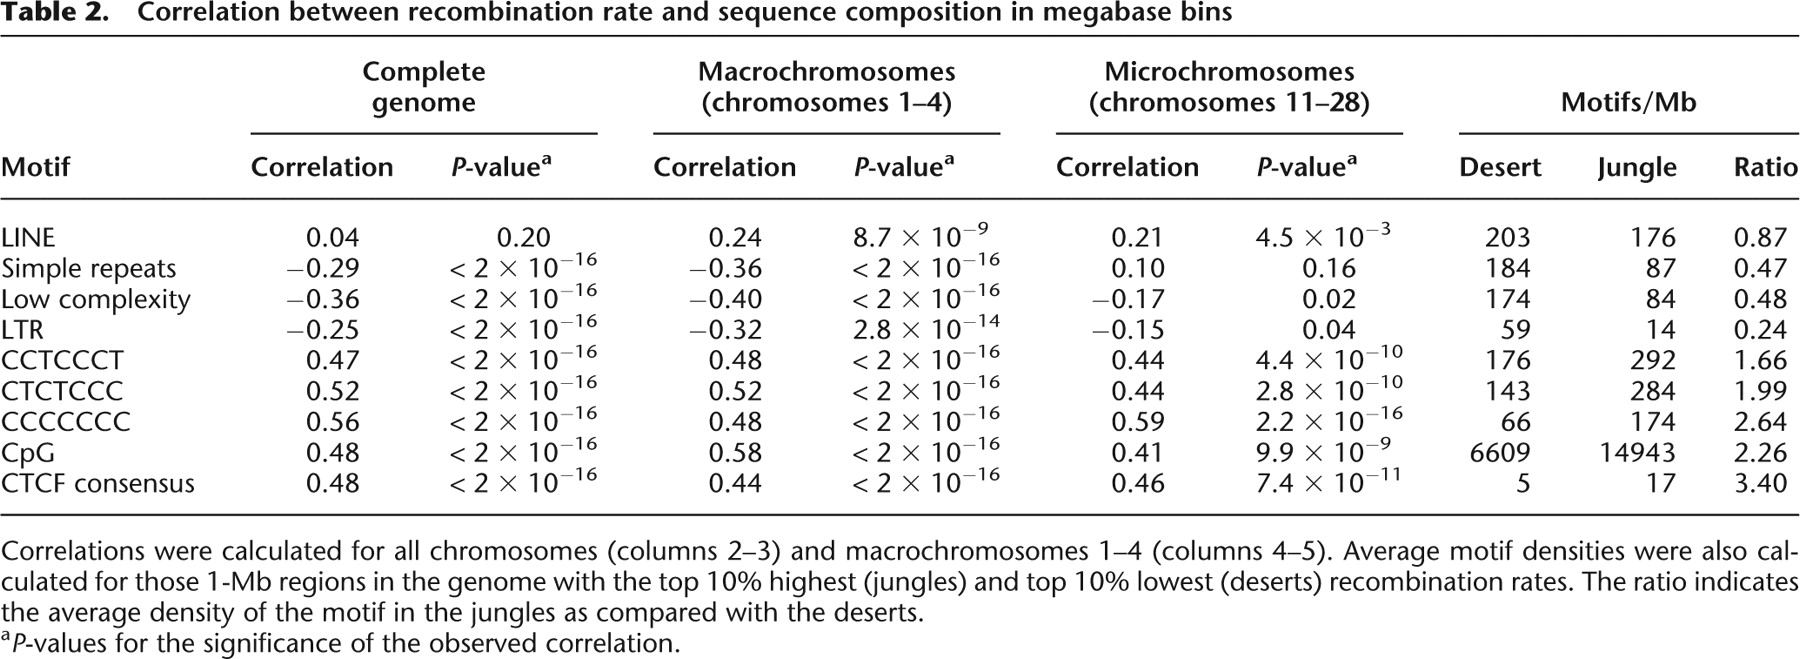
Table 2.
Correlation between recombination rate and sequence composition in megabase bins
Click on table to view larger version.
-
Correlations were calculated for all chromosomes (columns 2–3) and macrochromosomes 1–4 (columns 4–5). Average motif densities were also calculated for those 1-Mb regions in the genome with the top 10% highest (jungles) and top 10% lowest (deserts) recombination rates. The ratio indicates the average density of the motif in the jungles as compared with the deserts.
-
aP-values for the significance of the observed correlation.


