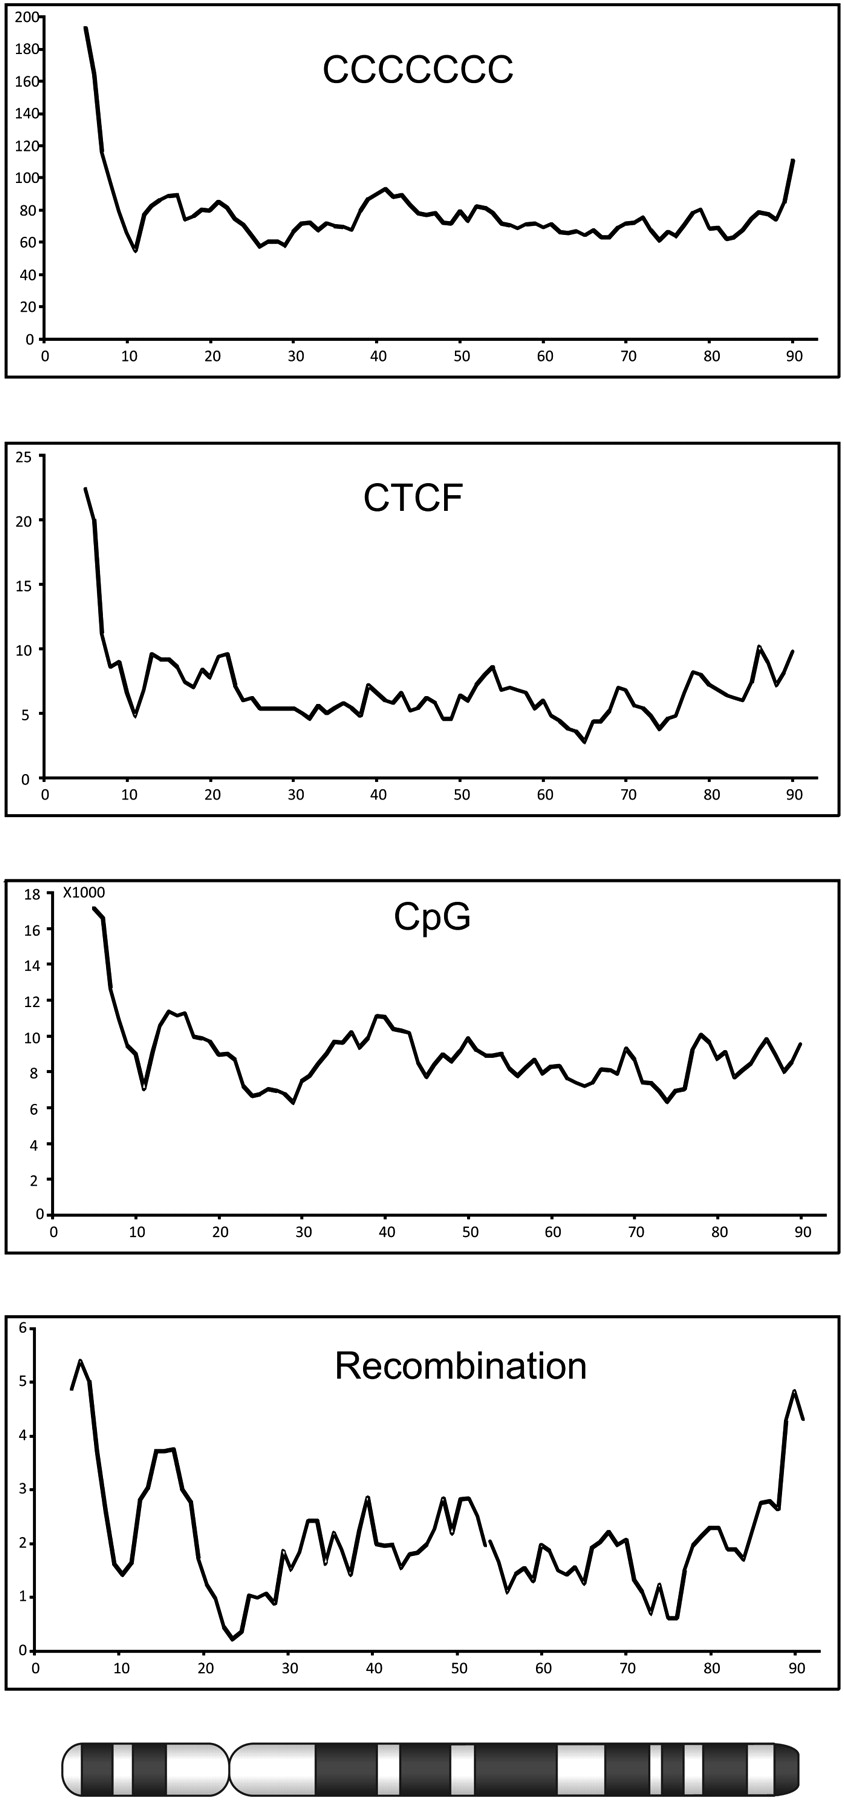
A high-density SNP-based linkage map of the chicken genome reveals sequence features correlated with recombination rate

(Downloading may take up to 30 seconds. If the slide opens in your browser, select File -> Save As to save it.)

Click on image to view larger version.

Figure 4.
Figure 4.

Distribution of recombination rates and sequence composition across chicken chromosome 4. The scale on the x-axis is in megabases, whereas the y-axis shows the number of elements per megabase or recombination rates in centimorgan/megabase. An ideogram of chromosome 4 is depicted below the x-axis.

This Article

  1. Genome Res. 19: 510-519

Preprint Server