
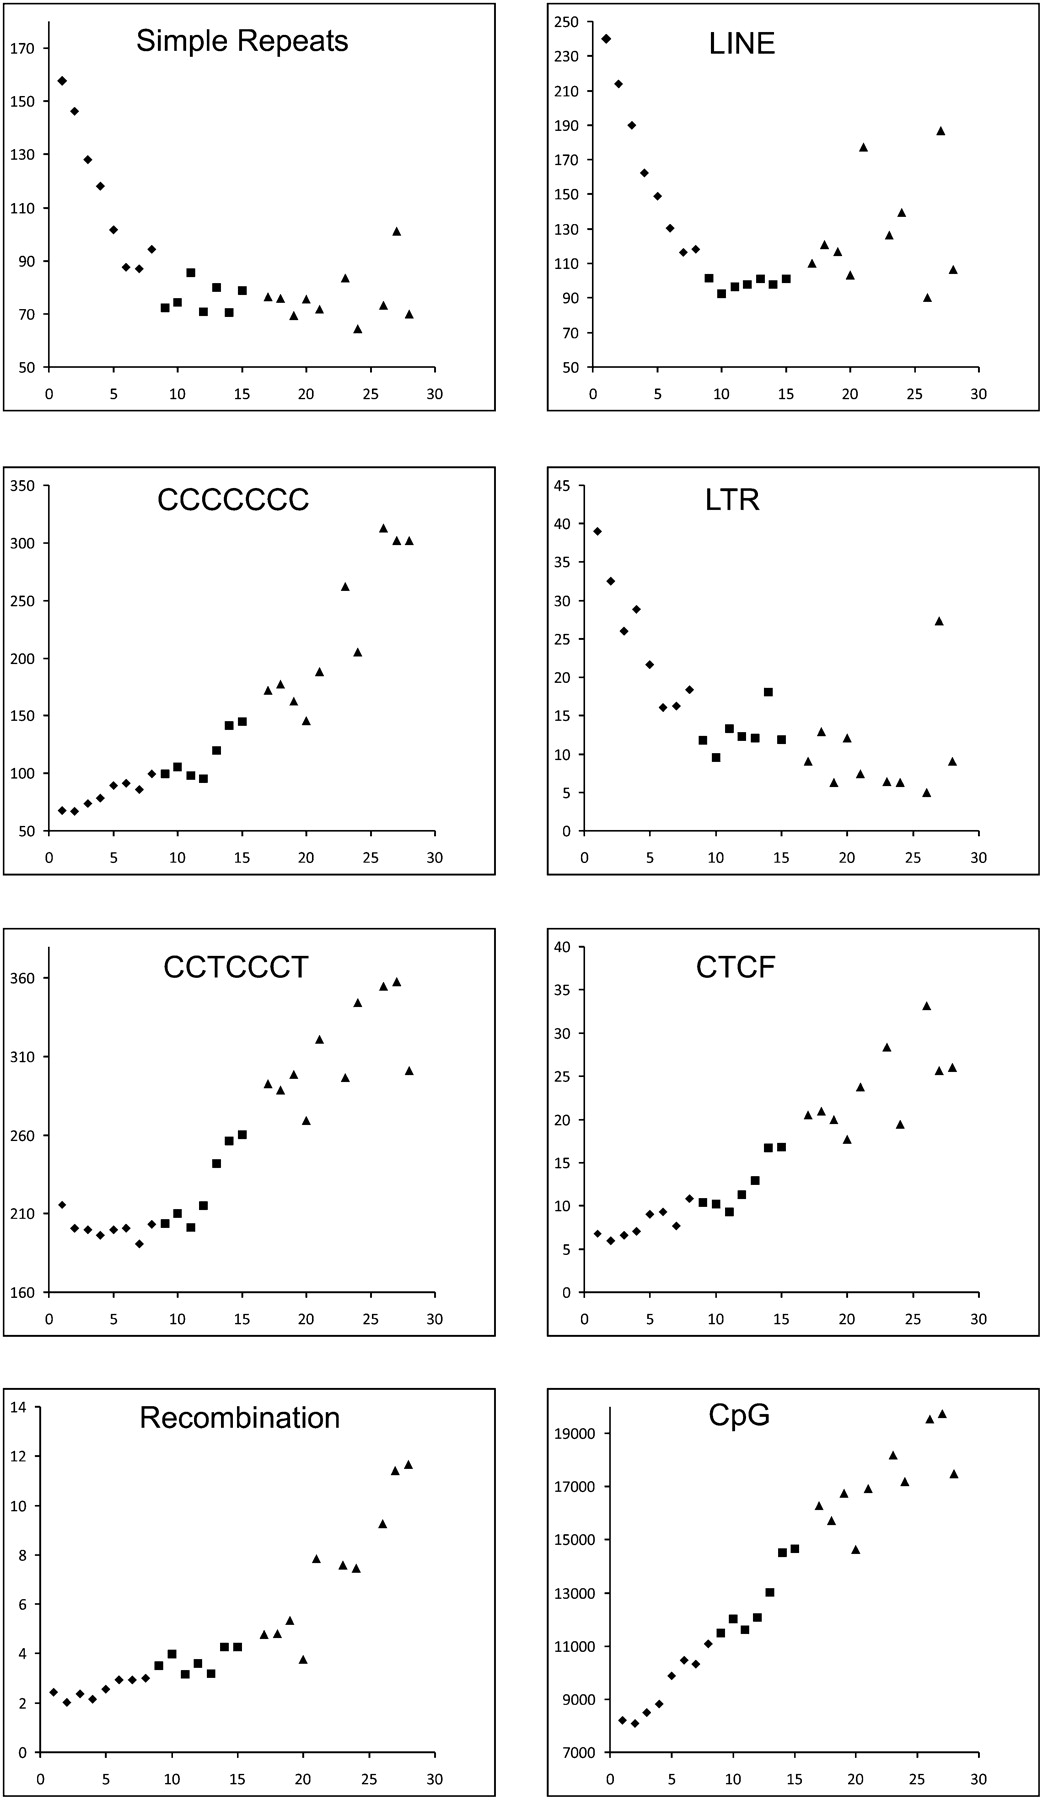
Figure 3.
Distribution of average recombination rates and sequence motif densities across chromosomes in chicken. The density plots for chromosomes 1–15 and 17–28 are shown. The scale on the x-axis represents the chromosome number and the y-axis represents the average number of elements per megabase or recombination rate in centimorgan/megabase. (♦) Macrochromosomes; (■) intermediate chromosomes; (▲) microchromosomes.


