
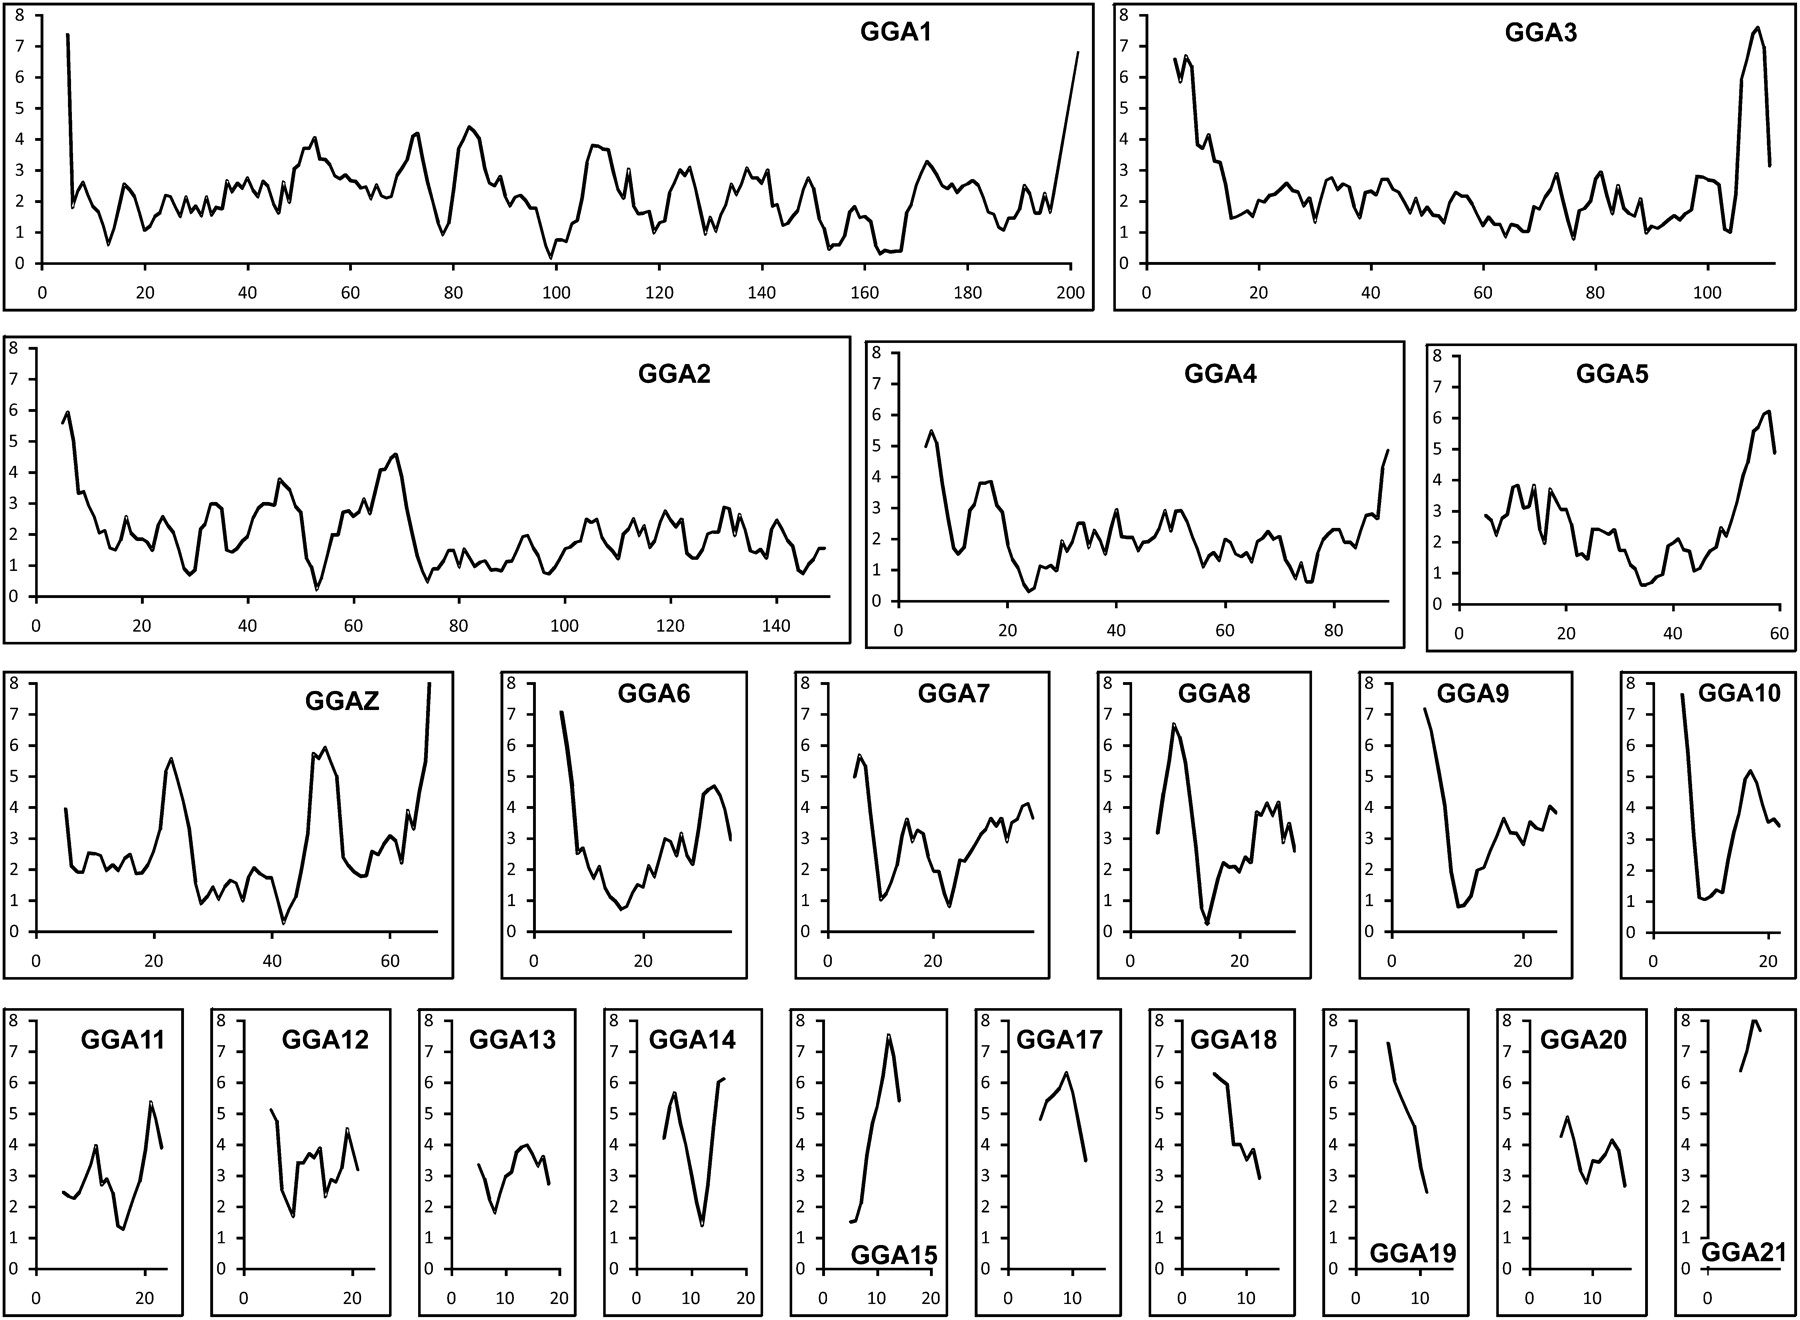
Figure 2.
Recombination rates of chicken chromosomes. Recombination rates were calculated for 1-Mb–sized bins and plotted as a sliding window showing the average recombination frequency for a window of 5 Mb. The scale on the x-axis is in megabases and the scale on the y-axis represents the recombination rate as centimorgan/megabase. Figures for chromosomes 22–28 are not included because of the small size of these chromosomes, resulting in uninformative plots.


