
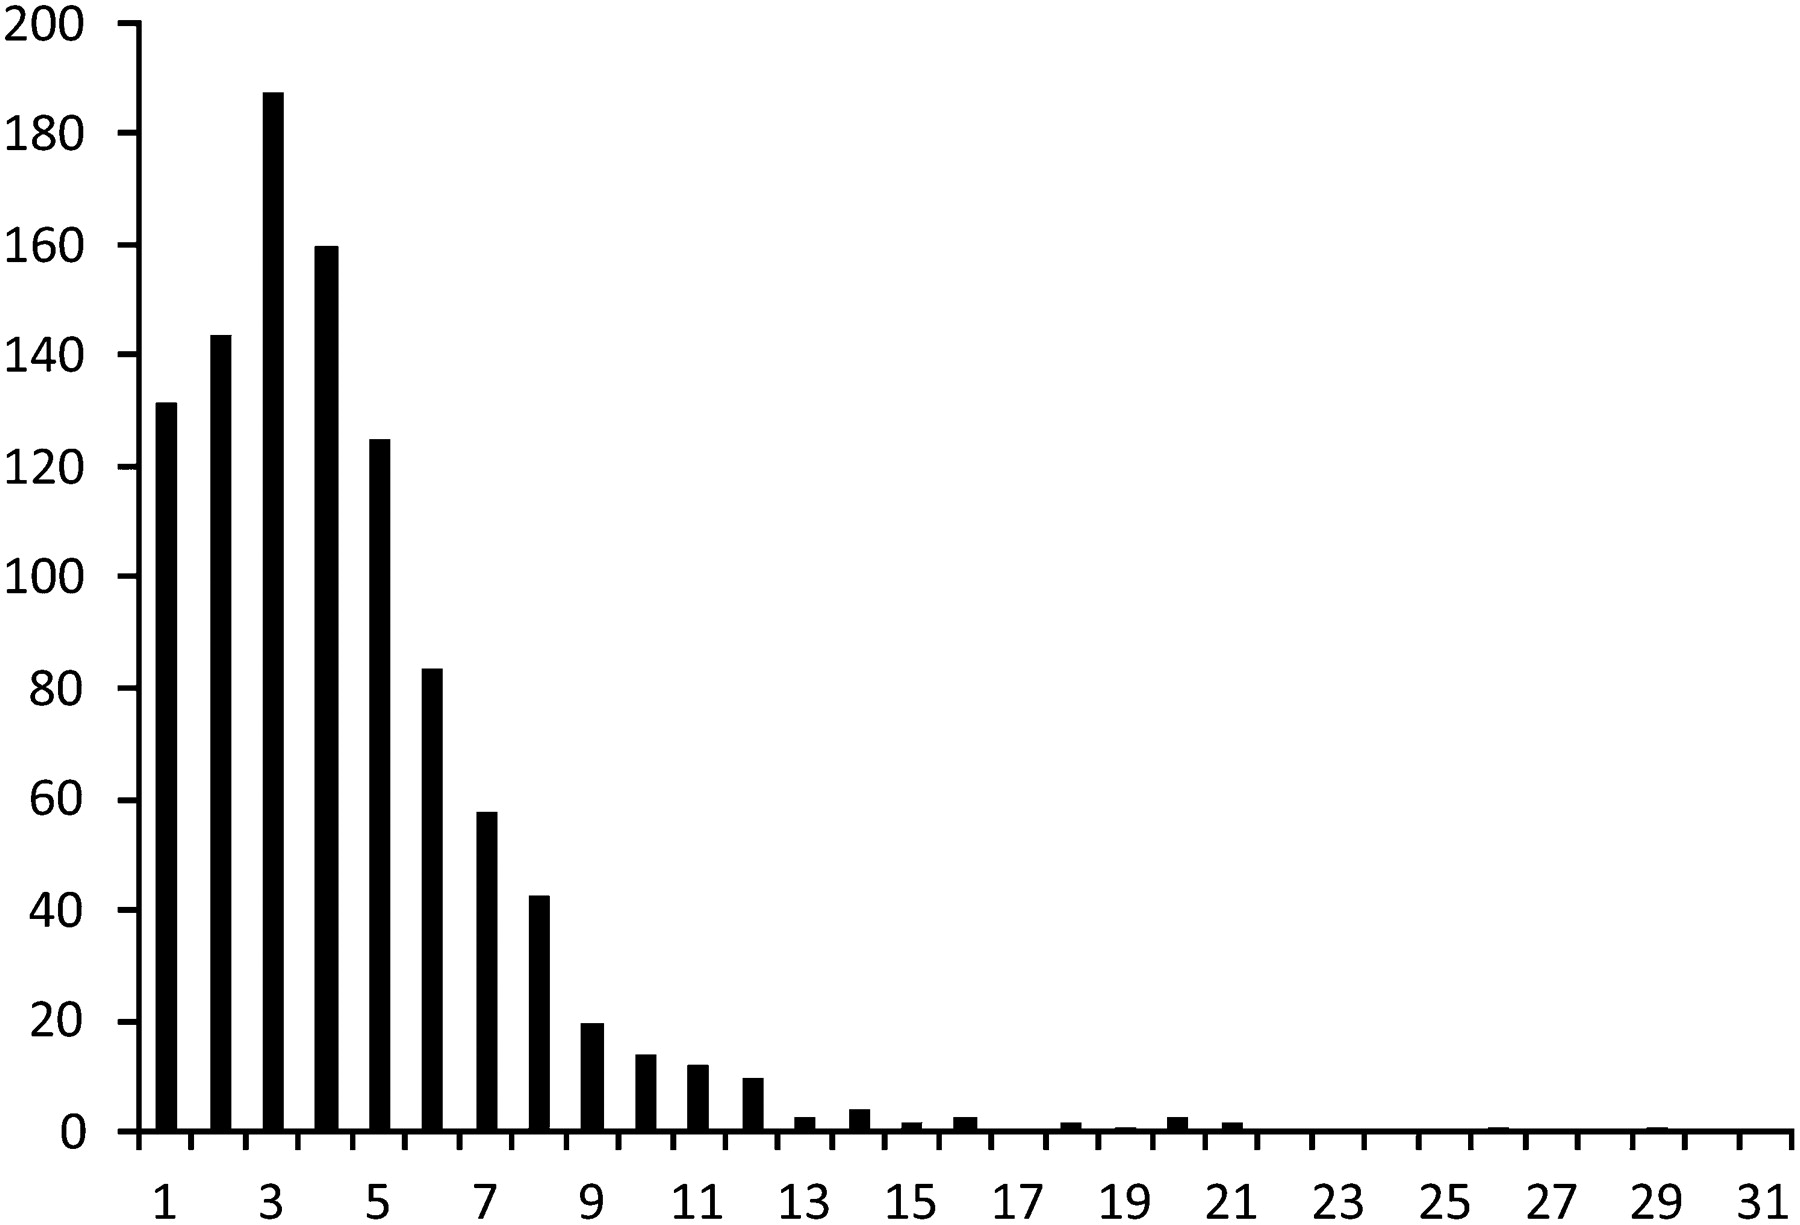
Figure 1.
Distribution of recombination rates for 1-Mb bins in the chicken genome. The x-axis shows the recombination rate as centimorgan/megabase. The y-axis shows the number of bins.


