
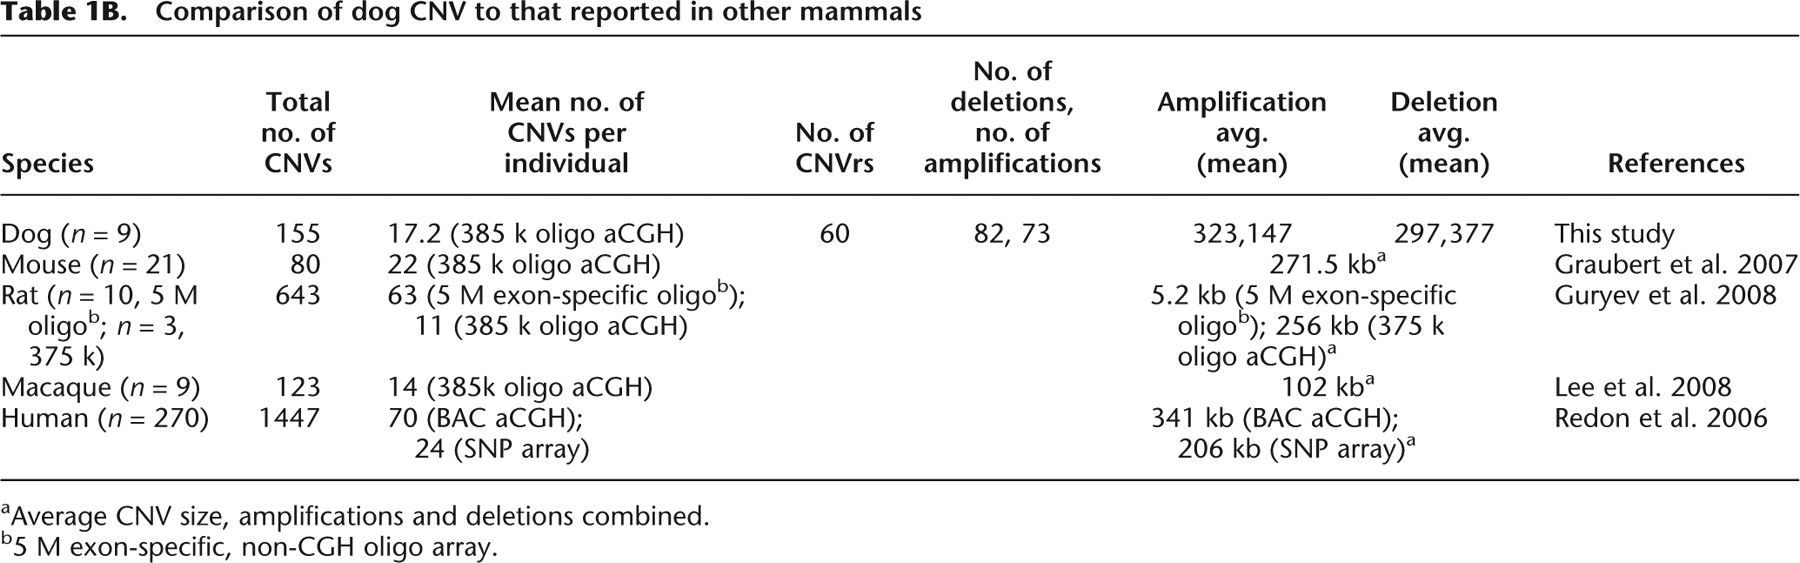
Table 1B.
Comparison of dog CNV to that reported in other mammals
Click on table to view larger version.
-
aAverage CNV size, amplifications and deletions combined.
-
b5 M exon-specific, non-CGH oligo array.


