
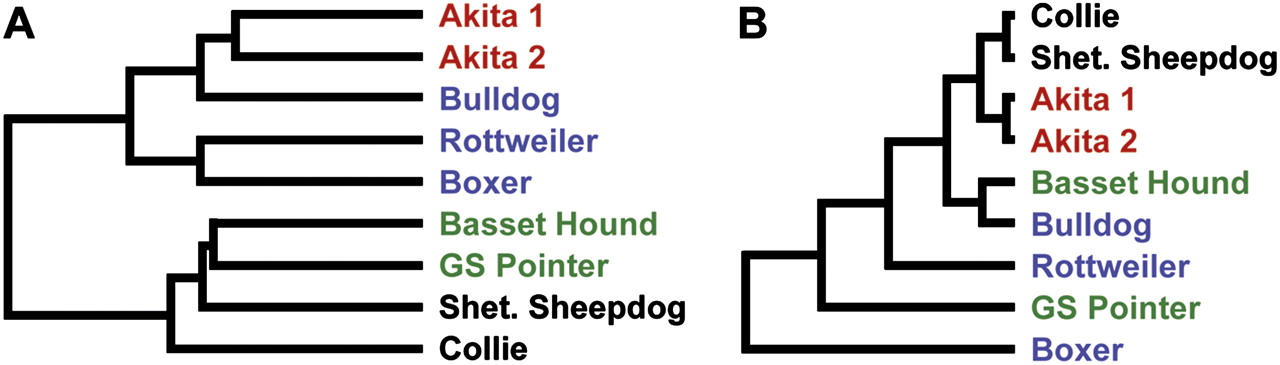
Cluster analysis. (A) Unbiased clustering of all high confidence probes altered in any of the CNV-discovery panel of dogs. Probe signals were clustered using hierarchical clustering (centroid linkage and the Pearson correlation as the distance, dChip 2005; Li and Wong 2001). CNV signal partially clusters dogs according to their breed class. Dog breeds are color-coded by breed class: Asian/ancient in red, Mastiff in blue, herding in black, and hunting in green. (Shet. Sheepdog) Shetland Sheepdog; (GS Pointer) German Shorthaired Pointer. (B) Clustering analysis of all aCGH probes for each dog. Hierarchical clustering was conducted with Genesis software (Sturn et al. 2002). All probe signals were used, except those from the X and Y chromosomes. Two of the groupings presumed to be true clusters show the shortest branch lengths: Collie and Shetland Sheepdog are both members of the Herding breed class; the two most similar dogs analyzed are two unrelated Akitas. The third pair is presumed to be a false clustering.


