
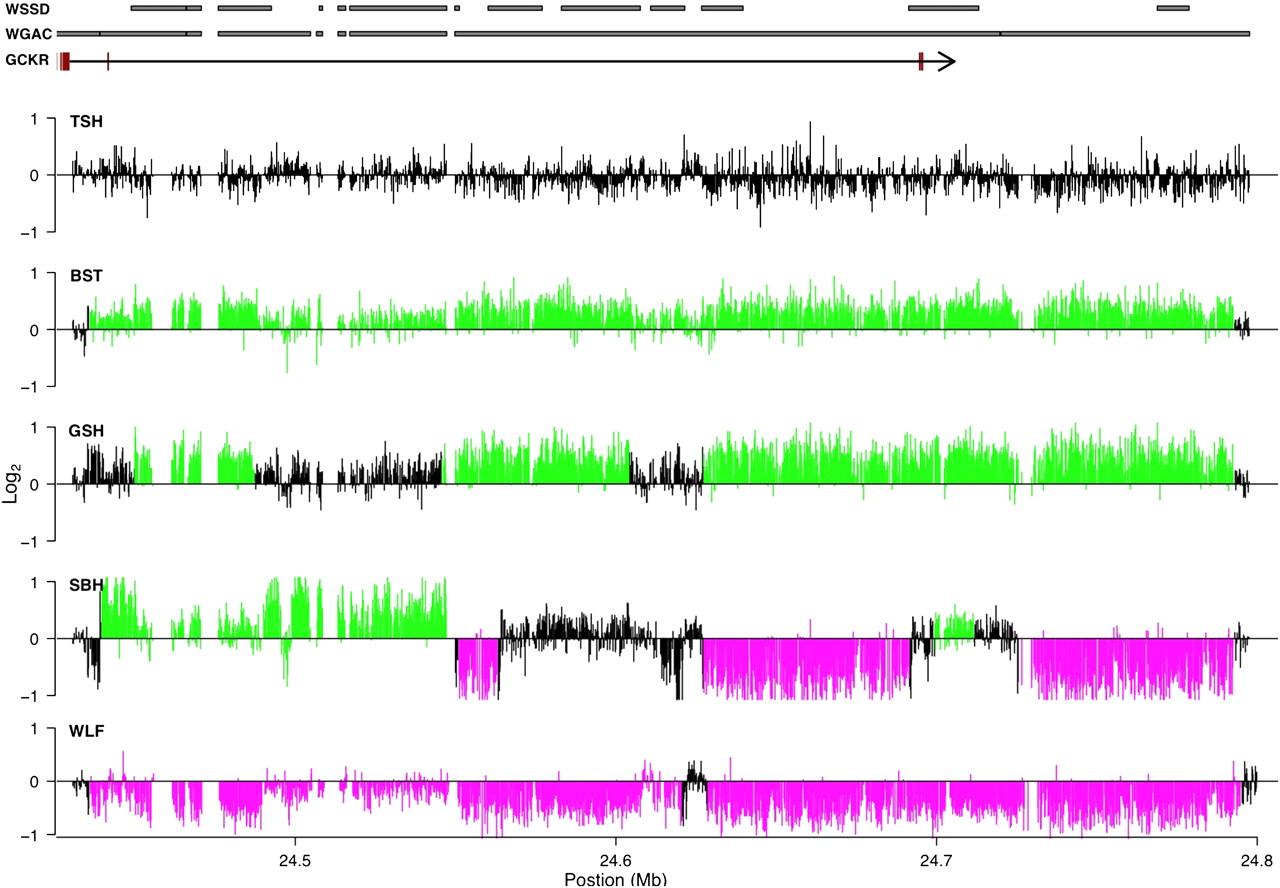
Example of a complex CNV region. Distribution of log2 probe intensities across a 400-kb region of chromosome 17 that shows substantial variation in breakpoints across individuals and spatial heterogeneity of copy number within individuals. Black, green, and magenta indicate regions called as no copy number variation, gains, and losses, respectively. The gene structure of GCKR is shown, with black lines and red boxes corresponding to introns and exons, respectively. For clarity, additional RefSeq genes are not shown. Regions with significant WGAC or WSSD scores are indicated by gray rectangles. Breeds are abbreviated as described in Figure 3.


