
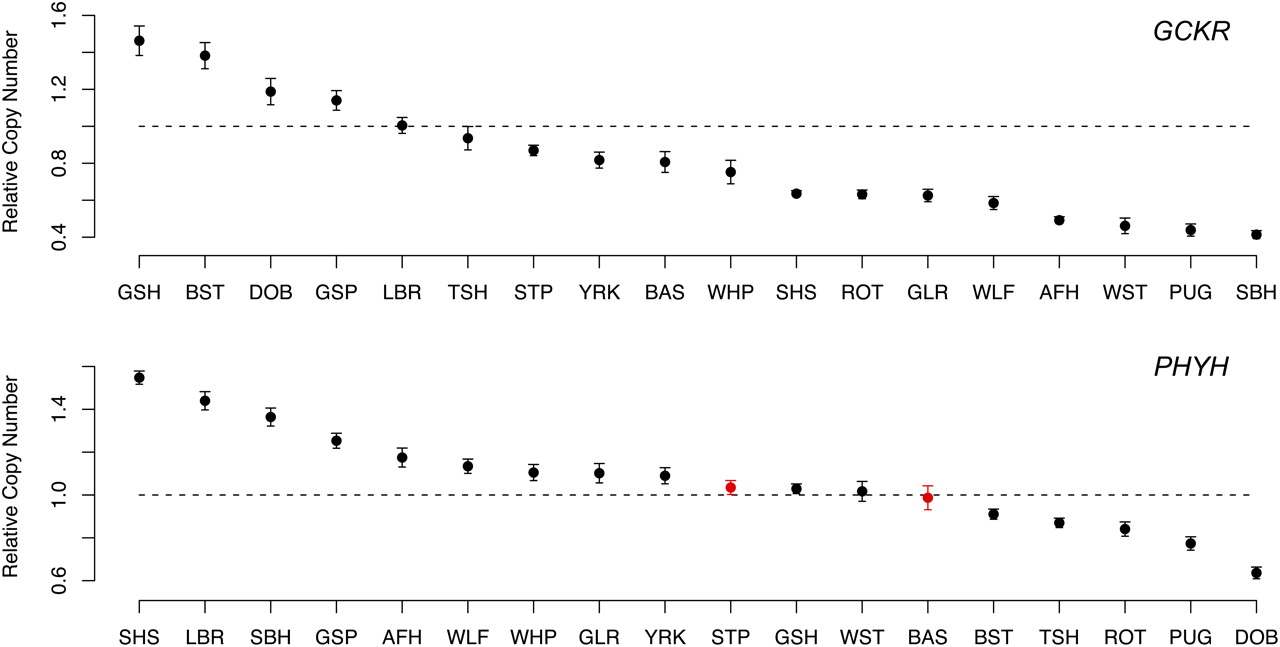
qPCR of GCKR and PHYH regions. Each plot shows the relative copy number in comparison to the reference (y-axis) for each breed (x-axis). The reference sample was the same Boxer that was used as the reference in the aCGH experiments. Note that because the GCKR and PHYH regions are located in segmental duplications, a gain or loss is not expected to yield a relative copy change of 2 and 0.5, respectively. For example, if the reference sample contains three copies, a gain in the test sample would result in an expected relative copy number of 1.33. Vertical bars delimit 95% confidence intervals based on six independent replicates. False positives (CNVs predicted in the aCGH data but not confirmed by qPCR) are colored in red. Breed abbreviations are described in Figure 3.


