
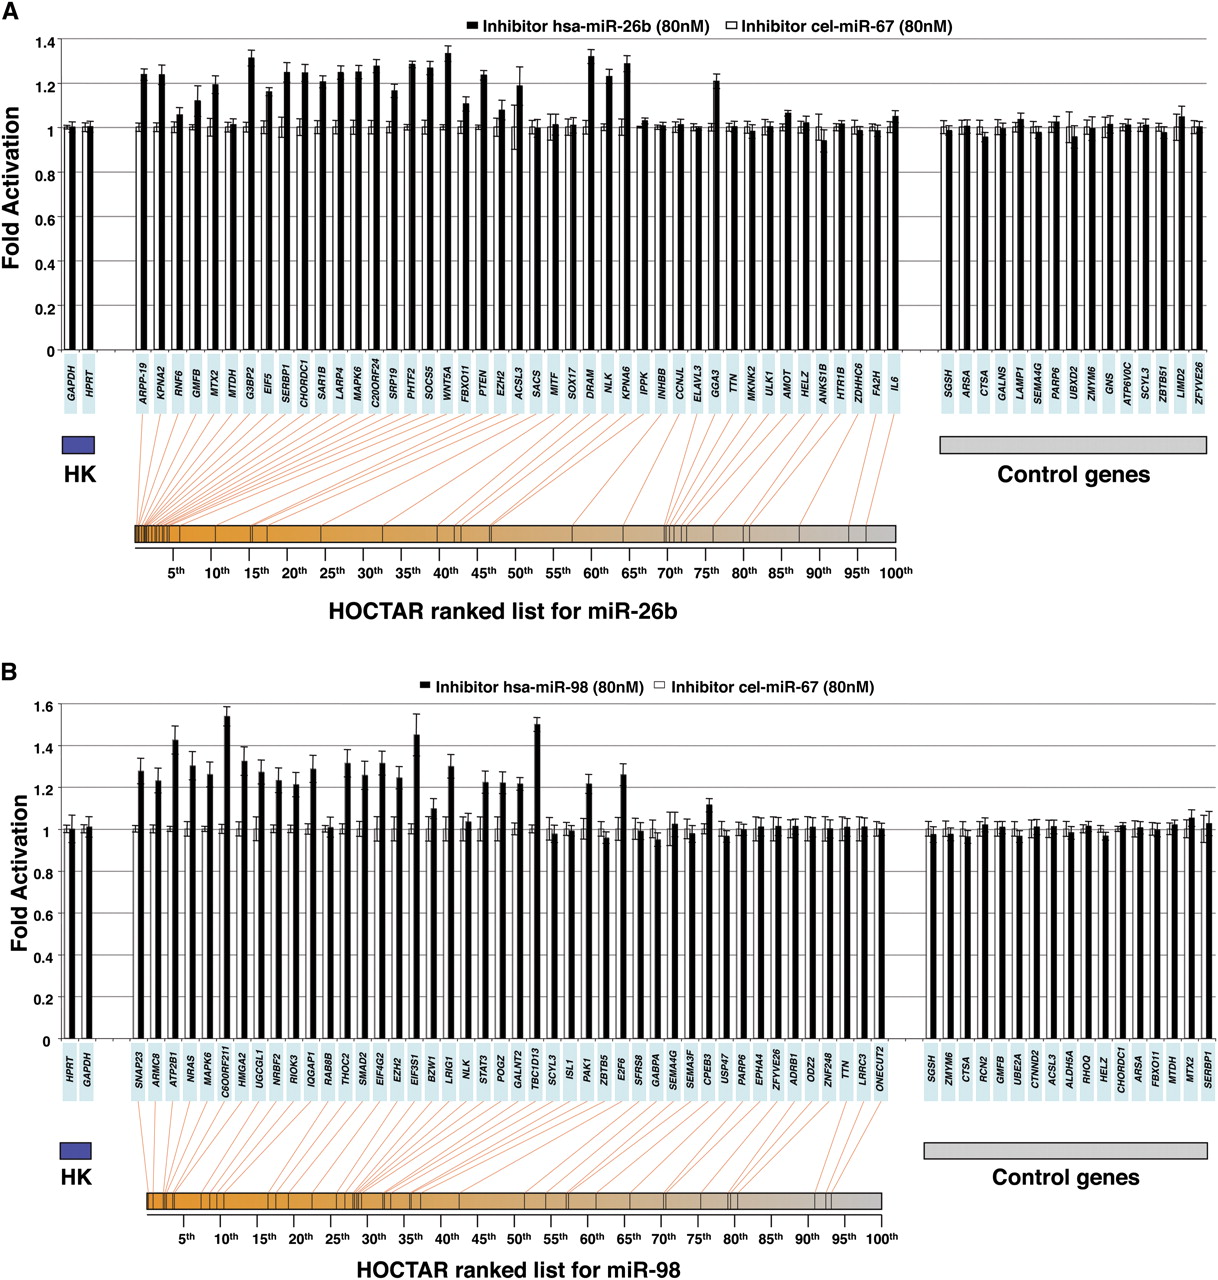
Experimental validation of the HOCTAR procedure by down-regulation of miR-26b and miR-98 in HeLa cells. Histogram showing differences in the expression levels between HeLa cells transfected with a miRNA-inhibitor (black bars) and control (cel-miR-67 transfected) HeLa cells (white bars), of a subset of HOCTAR predicted target genes for miR-26b (A) and miR-98 (B) and of a subset of control genes by qRT-PCR assays. Y-axis: fold change activation (expressed as 2−ΔΔCt values). X-axis: predicted target genes tested (their symbols are indicated in the light blue boxes). The target genes tested were distributed along the entire HOCTAR ranked prediction lists for miR-26b (A) and miR-98 (B) and the red lines below the diagrams indicate the ranking of each target genes tested within the HOCTAR prediction ranked list for miR-26b (A) and miR-98 (B). The control genes shown on the right part of the two diagrams are not predicted to represent targets of the two analyzed miRNAs. The housekeeping (HK) genes used to normalize the expression of genes are HPRT1 and GAPDH. The analysis of each gene tested was performed in triplicate.


