
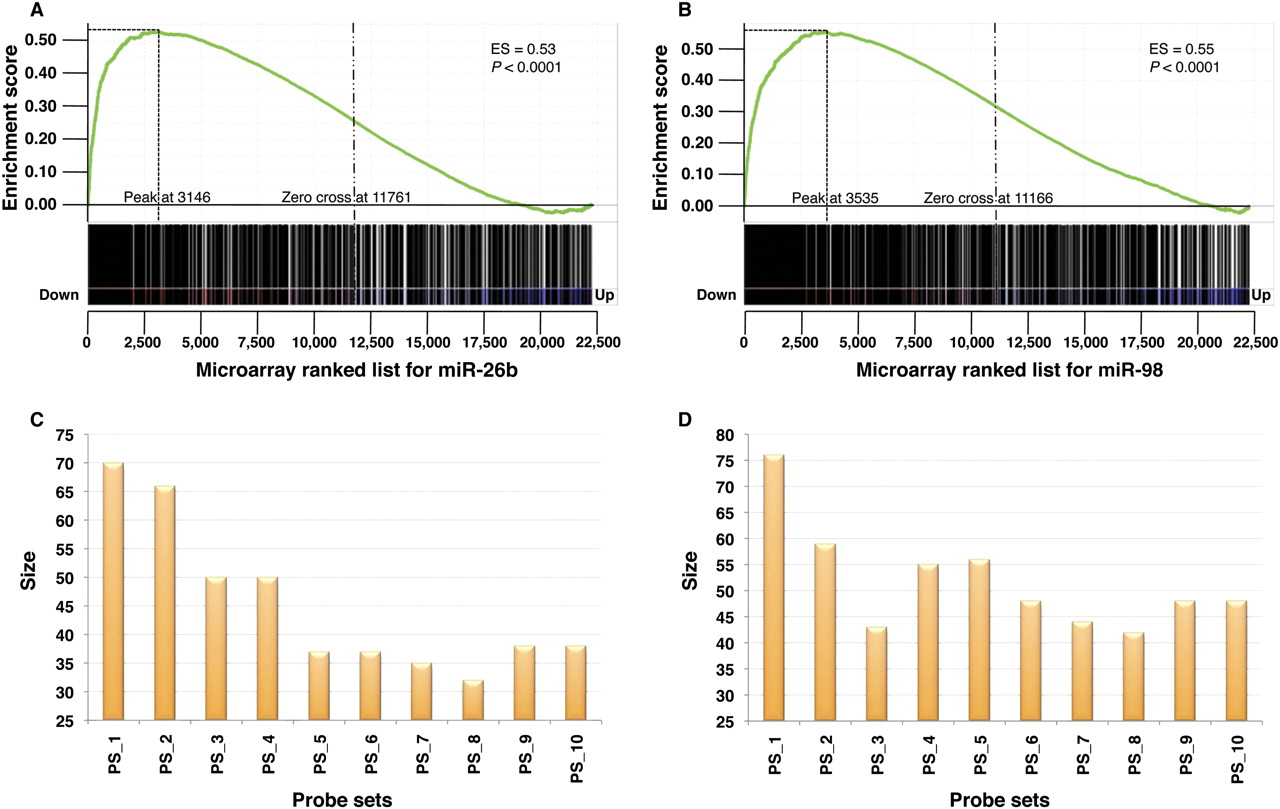
Genes down-regulated after miR-26b and miR-98 overexpression are overrepresented in high-scoring HOCTAR predictions, as determined by microarray analysis. Enrichment plots generated by GSEA analysis of the HOCTAR predictions list for miR-26b and miR-98 are represented in A and B. The enrichment score is shown as a green line in each plot, and the vertical black bars below the plots indicate the position of probes belonging to the HOCTAR prediction lists for miR-26b within the rank ordering of the 22,277 probes present on the human U133A microarray from the probe most down-regulated (position 1 on the left) to the most up-regulated in HeLa cells after miR-26b (A) and miR-98 (B) transfection. (C,D) Histograms showing the number of probes with significant expression changes in HeLa cells after miR-26b (C) and miR-98 (D) overexpression (size, Y-axis). Each bar represents one of the 10 bins (probe sets, X-axis) in which the entire HOCTAR lists for miR-26b and miR-98 were subdivided (see the text for further details).


