
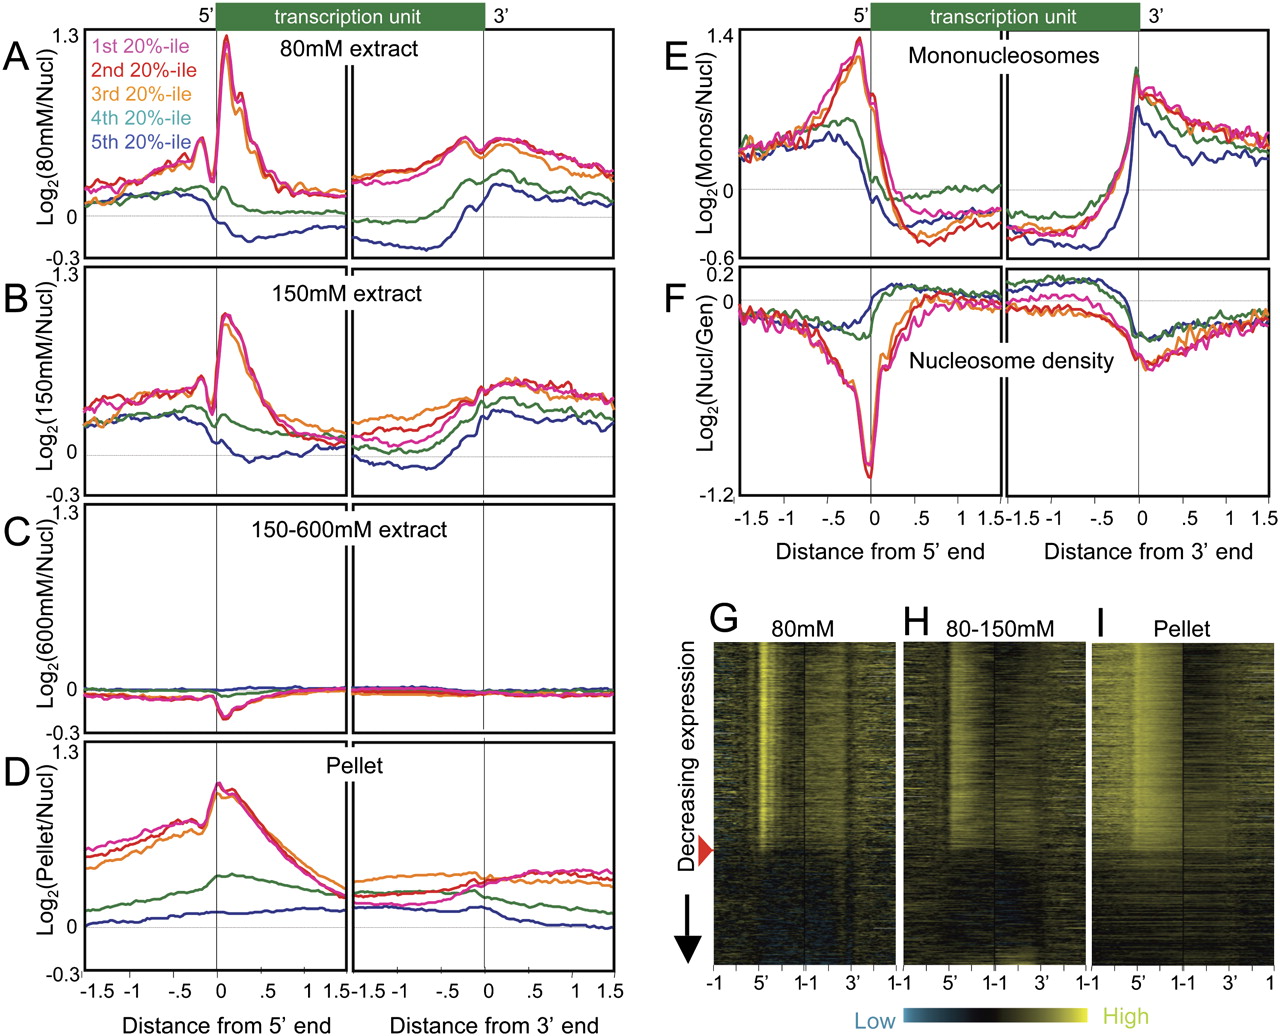
Active and inactive genes display contrasting profiles in salt-extracted chromatin fractions. (A) Ends analysis of chromatin extracted with 80 mM salt, divided into quintile groupings based on gene expression levels in Supplemental Table S1. Averages from eight independent experiments are shown. The 9247 genes for which both ends are known were aligned at their 5′ and their 3′ ends and averaged for each 25-bp interval on either side. Contributions from neighboring transcription units were omitted. (B) Same as A except that 150 mM fractions from three independent experiments were profiled, averaged, and plotted on the same scale. (C) Same as A except that the 150–600 mM fractions from three independent experiments were profiled, averaged, and plotted on the same scale. (D) Same as A except that pellet fractions from three independent experiments were profiled, averaged, and plotted on the same scale. (E) Ends analysis of mononucleosomes isolated by agarose gel purification from DNA obtained from MNased nucleosomes extracted using EDTA and shearing. An average from two experiments is shown. (F) Ends analysis profile of nucleosome density averaged from three independent experiments. (G) A representative heat map profile for 80 mM–extracted chromatin. The red arrowhead indicates the cutoff used to separate active from inactive genes for the analyses shown in Fig. 4. 5′ (left) and 3′ (right) end profiles for ±1 kb from single representative experiments are shown, ordered by decreasing expression, based on cDNA levels measured as a log-ratio over genomic DNA using the same array design as for chromatin profiling, with probes for each gene chosen algorithmically. Contributions from neighboring transcription units were omitted, which resulted in some horizontal gray streaks toward the upstream and downstream sides of each map. Contrast levels are equal for all stacks (Java TreeView setting of 2.0). (H) Same as G for a representative chromatin fraction extracted with 150 mM NaCl following an 80 mM extraction (80–150 mM). (I) Same as H for the corresponding pellet fraction.


