
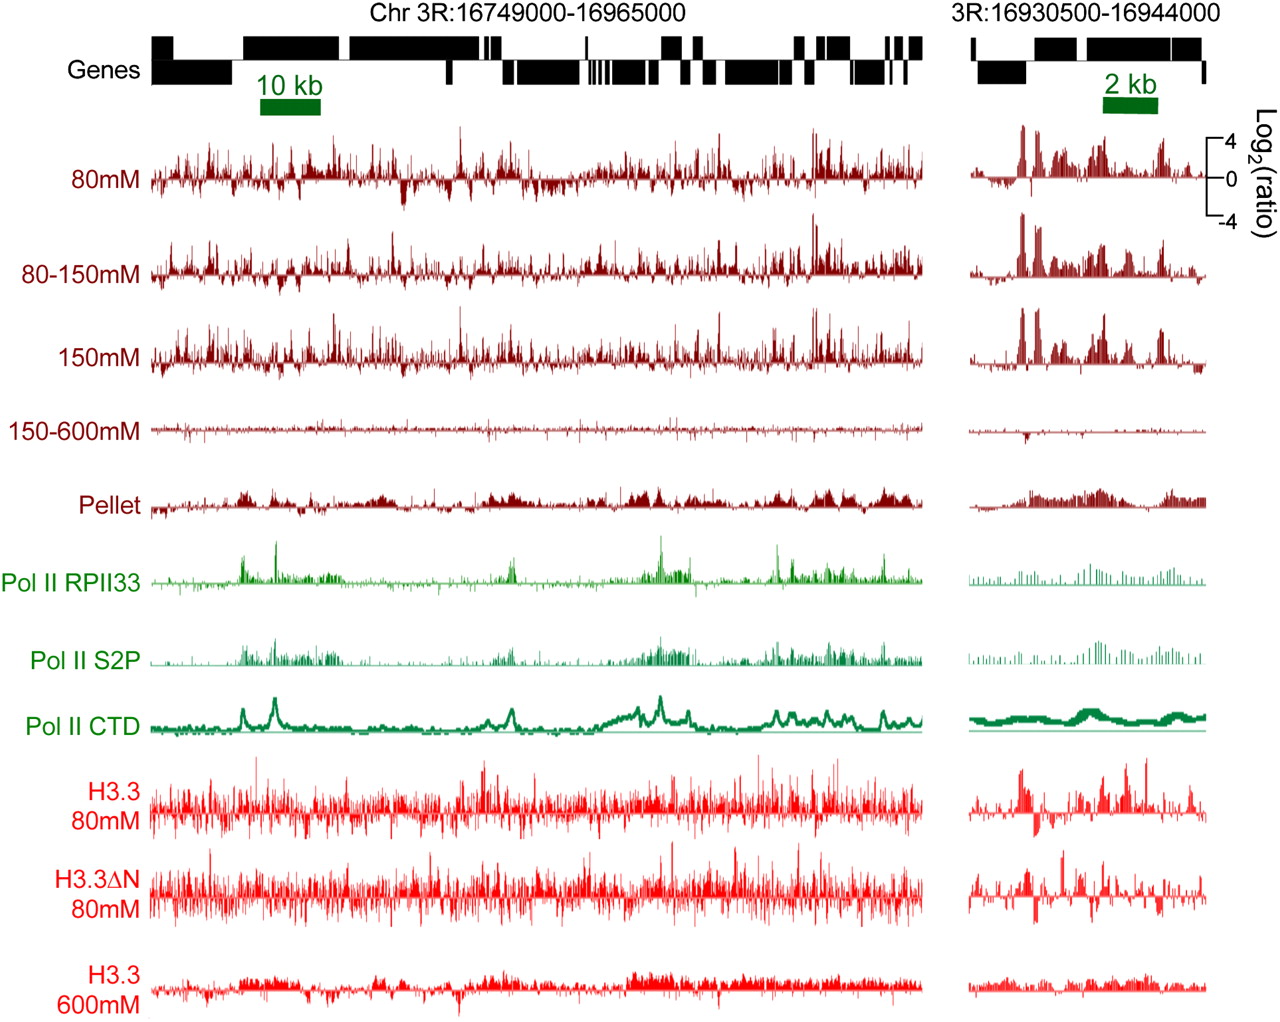
Salt-extracted chromatin fractions display different chromatin landscapes. Tracks show profiles for a typical gene-rich region of the fly genome. Salt-extracted chromatin fractions (brown), Pol II (green), and H3.3 (red) recovered from these fractions are all displayed on the same log2-ratio scale. Pol II tracks are calculated from published data for different Pol II epitopes: the RPII33 subunit, serine-2-phosphate on the C-terminal domain (CTD), and the unphosphorylated CTD (Muse et al. 2007; Misulovin et al. 2008). An expansion of a subregion is shown on the right. The 80–150 mM fraction derives from a 150 mM extraction following an 80 mM extraction, and the 150–600 mM fraction derives from a 600 mM extraction following a 150 mM extraction. All tracks represent single data sets; examples of tracks representing biological replicates of this region are shown in Supplemental Figure S1.


