
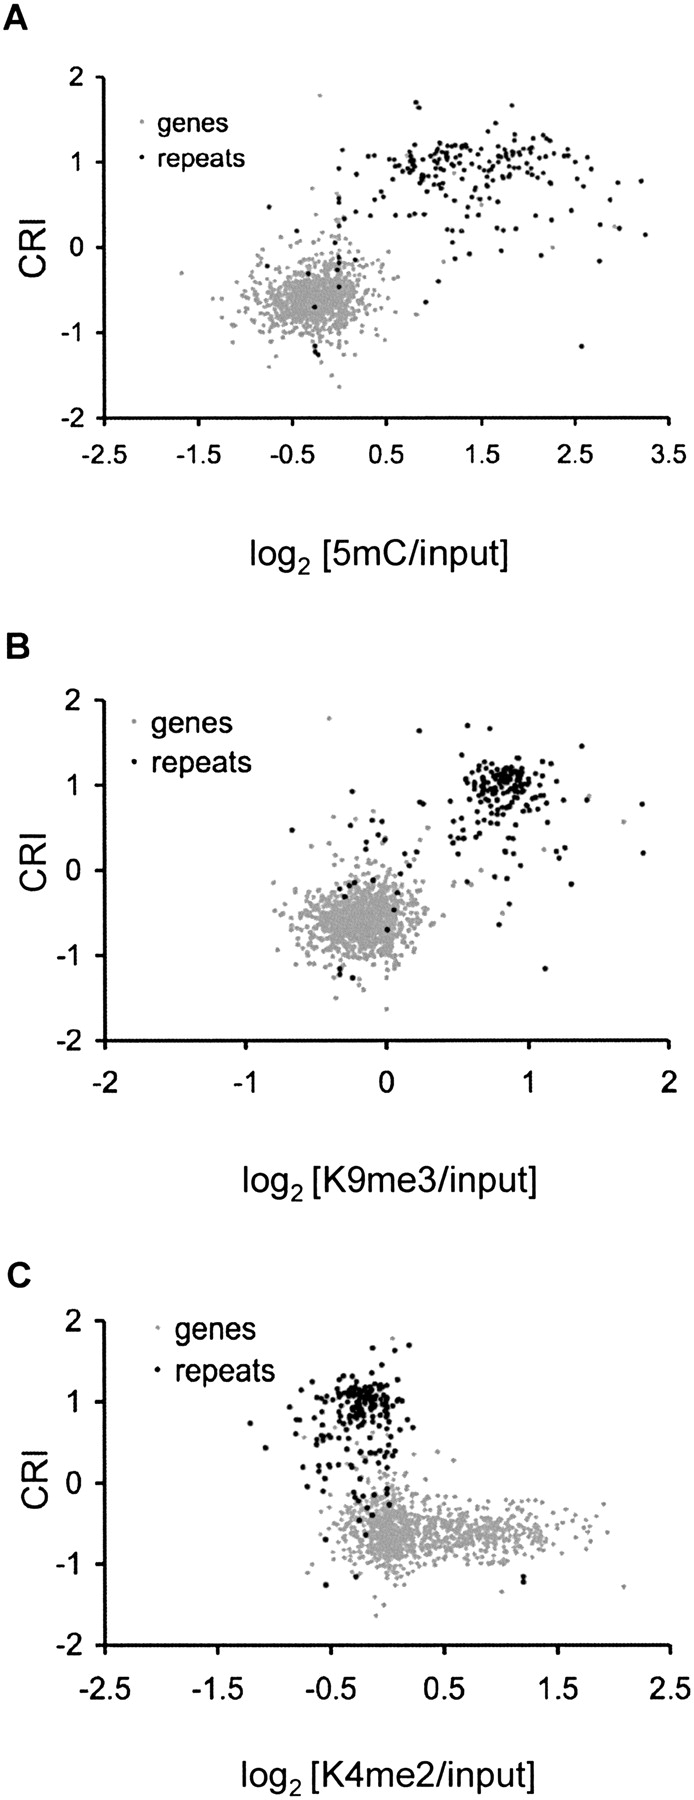
Figure 5.
Genes and repeats reside in distinct chromatin environments. Scatter plots depicting the relationship between RIP and chromatin modifications are shown for LGVII genes (gray dots) and repeats (black dots). The CRI value calculated for each predicted open reading frame and annotated repeat is plotted on the y-axis. The median enrichment value for (A) 5mC, (B) H3K9me3, and (C) H3K4me2 for each gene and annotated repeat is plotted on the x-axis.


