
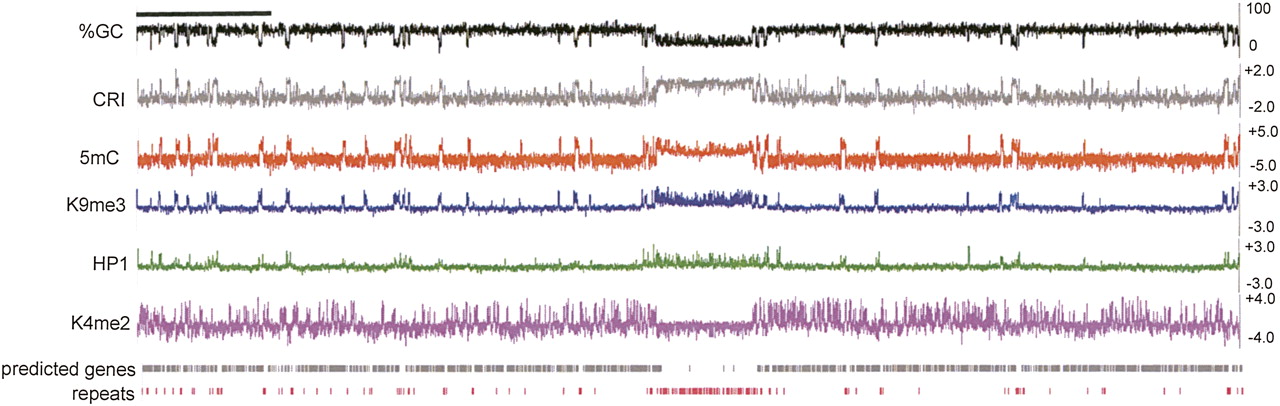
Figure 2.
Chromatin modification profile for N. crassa LGVII. Base composition of the 3.9 Mb LGVII is shown as the moving average of %GC and the CRI calculated for 500 bp windows with 100 bp steps at the top of the plot. Enrichment values for MeDIP and ChIP-chip experiments are shown as log2 values indicated on the y-axis (right) for immunoprecipitation experiments with antibodies to 5mC, H3K9me3, green fluorescent protein for HP1-GFP (HP1) and H3K4me2. The positions of predicted open reading frames (predicted genes) and repeats are indicated below. The scale bar on the top left indicates 0.5 Mb.


