
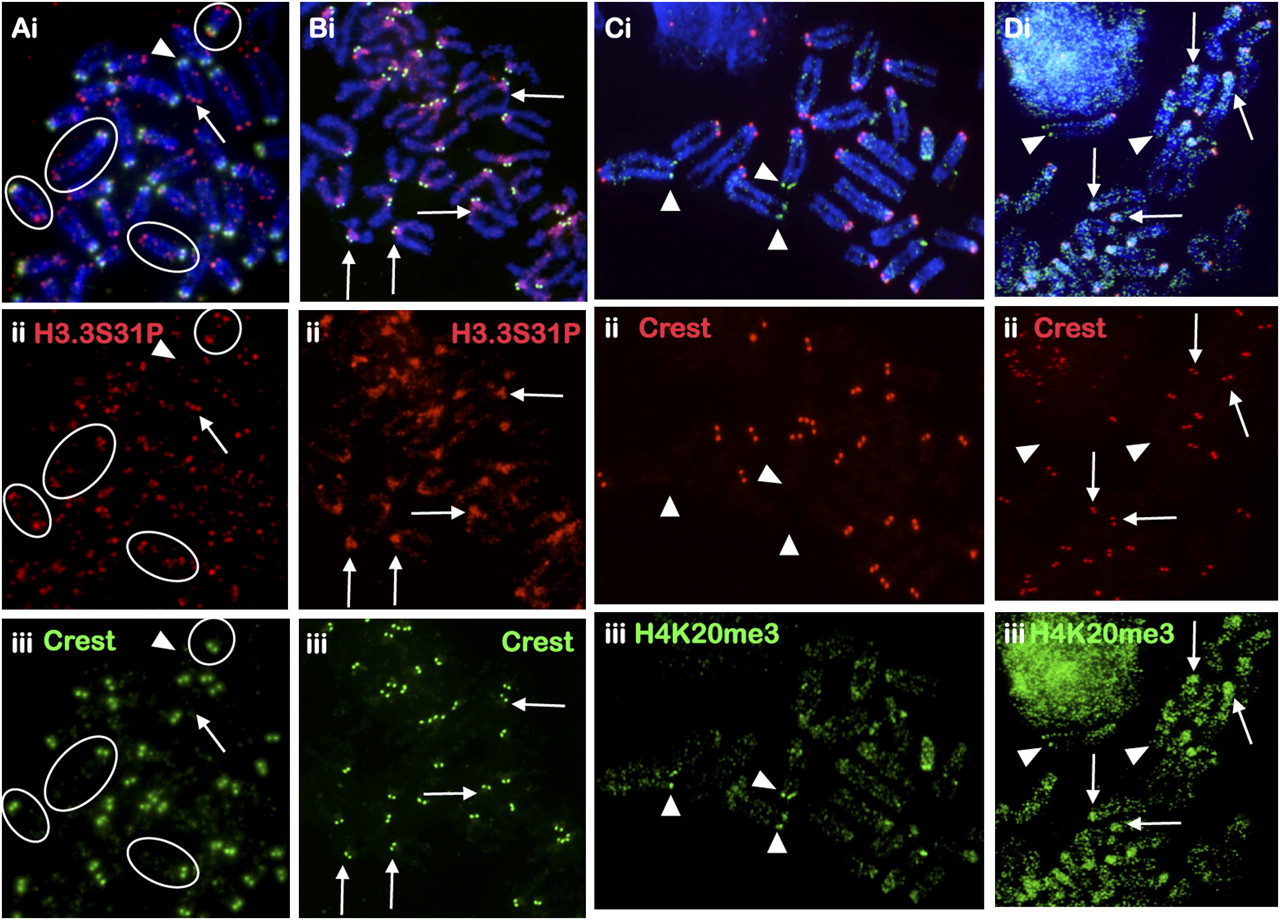
Cellular distribution of H3.3S31P and H4K20me3 in mouse EG cells. (A) H3.3S31P is enriched at the telomeres of EG cell lines EGRA2 using antiserum against H3.3S31P (ii, red; Abcam; some circled examples are indicated). Signals at the “short-arm” telomeres (arrowheads) of the telocentric chromosomes are in general weaker and more variable than those on the “long-arm” telomeres (arrows); telocentric ends are easily identifiable by their close proximity to the centromere, as marked by CREST staining (iii, green). (B) Some H3.3S31P signals are also detected on the long arms of the chromosomes. Six days of LIF depletion/RA treatment resulted in a significant decrease in telomeric H3.3S31P (ii, red) and increase in H3.3S31P signal at the pericentric heterochromatin (some examples are indicated by arrows). (C) Overall H4K20me3 (iii, green; Abcam) staining in EGRA2 cells was weak with some telomeres showing slightly stronger signals (arrowheads). (D) Six days of differentiation led to increased H4K20me3 signal (iii, green) at the pericentric heterochromatin (arrows). Red signals (C,D, ii) represent CREST at the centromeres. Immunofluorescence analysis of H3.3S31P and H4K20me3 in another mouse EG cell is shown in Supplemental Figure 6.


